
We completed our last rare plant survey in July, and August has been taken over by seed collection and vegetation monitoring.
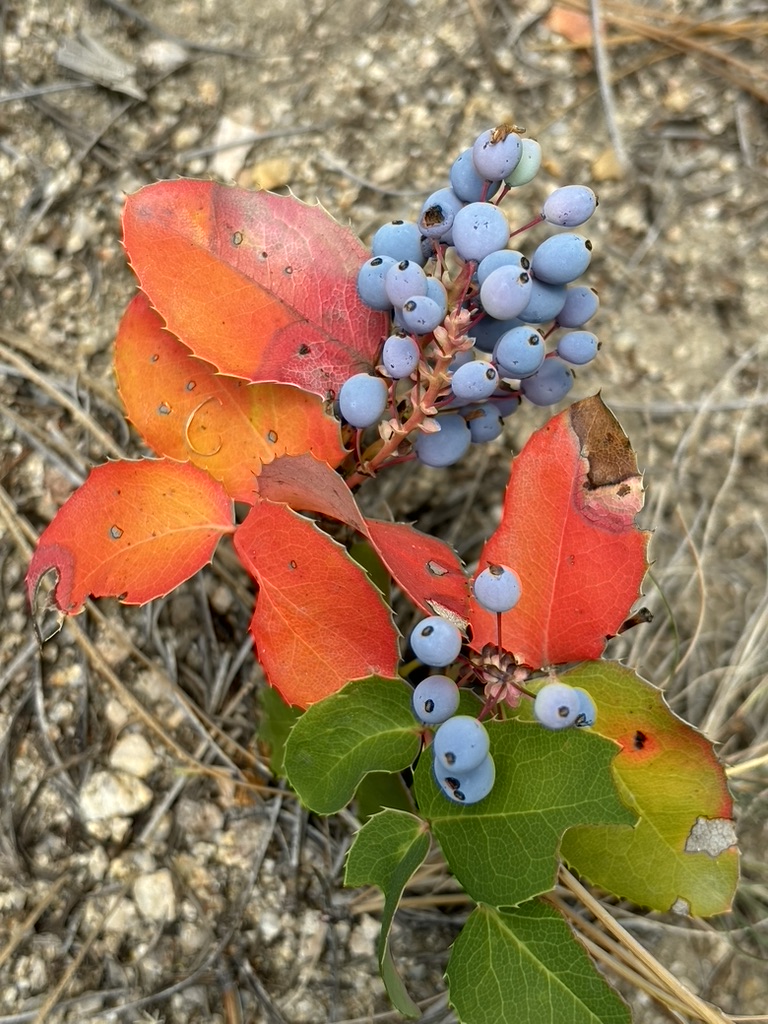
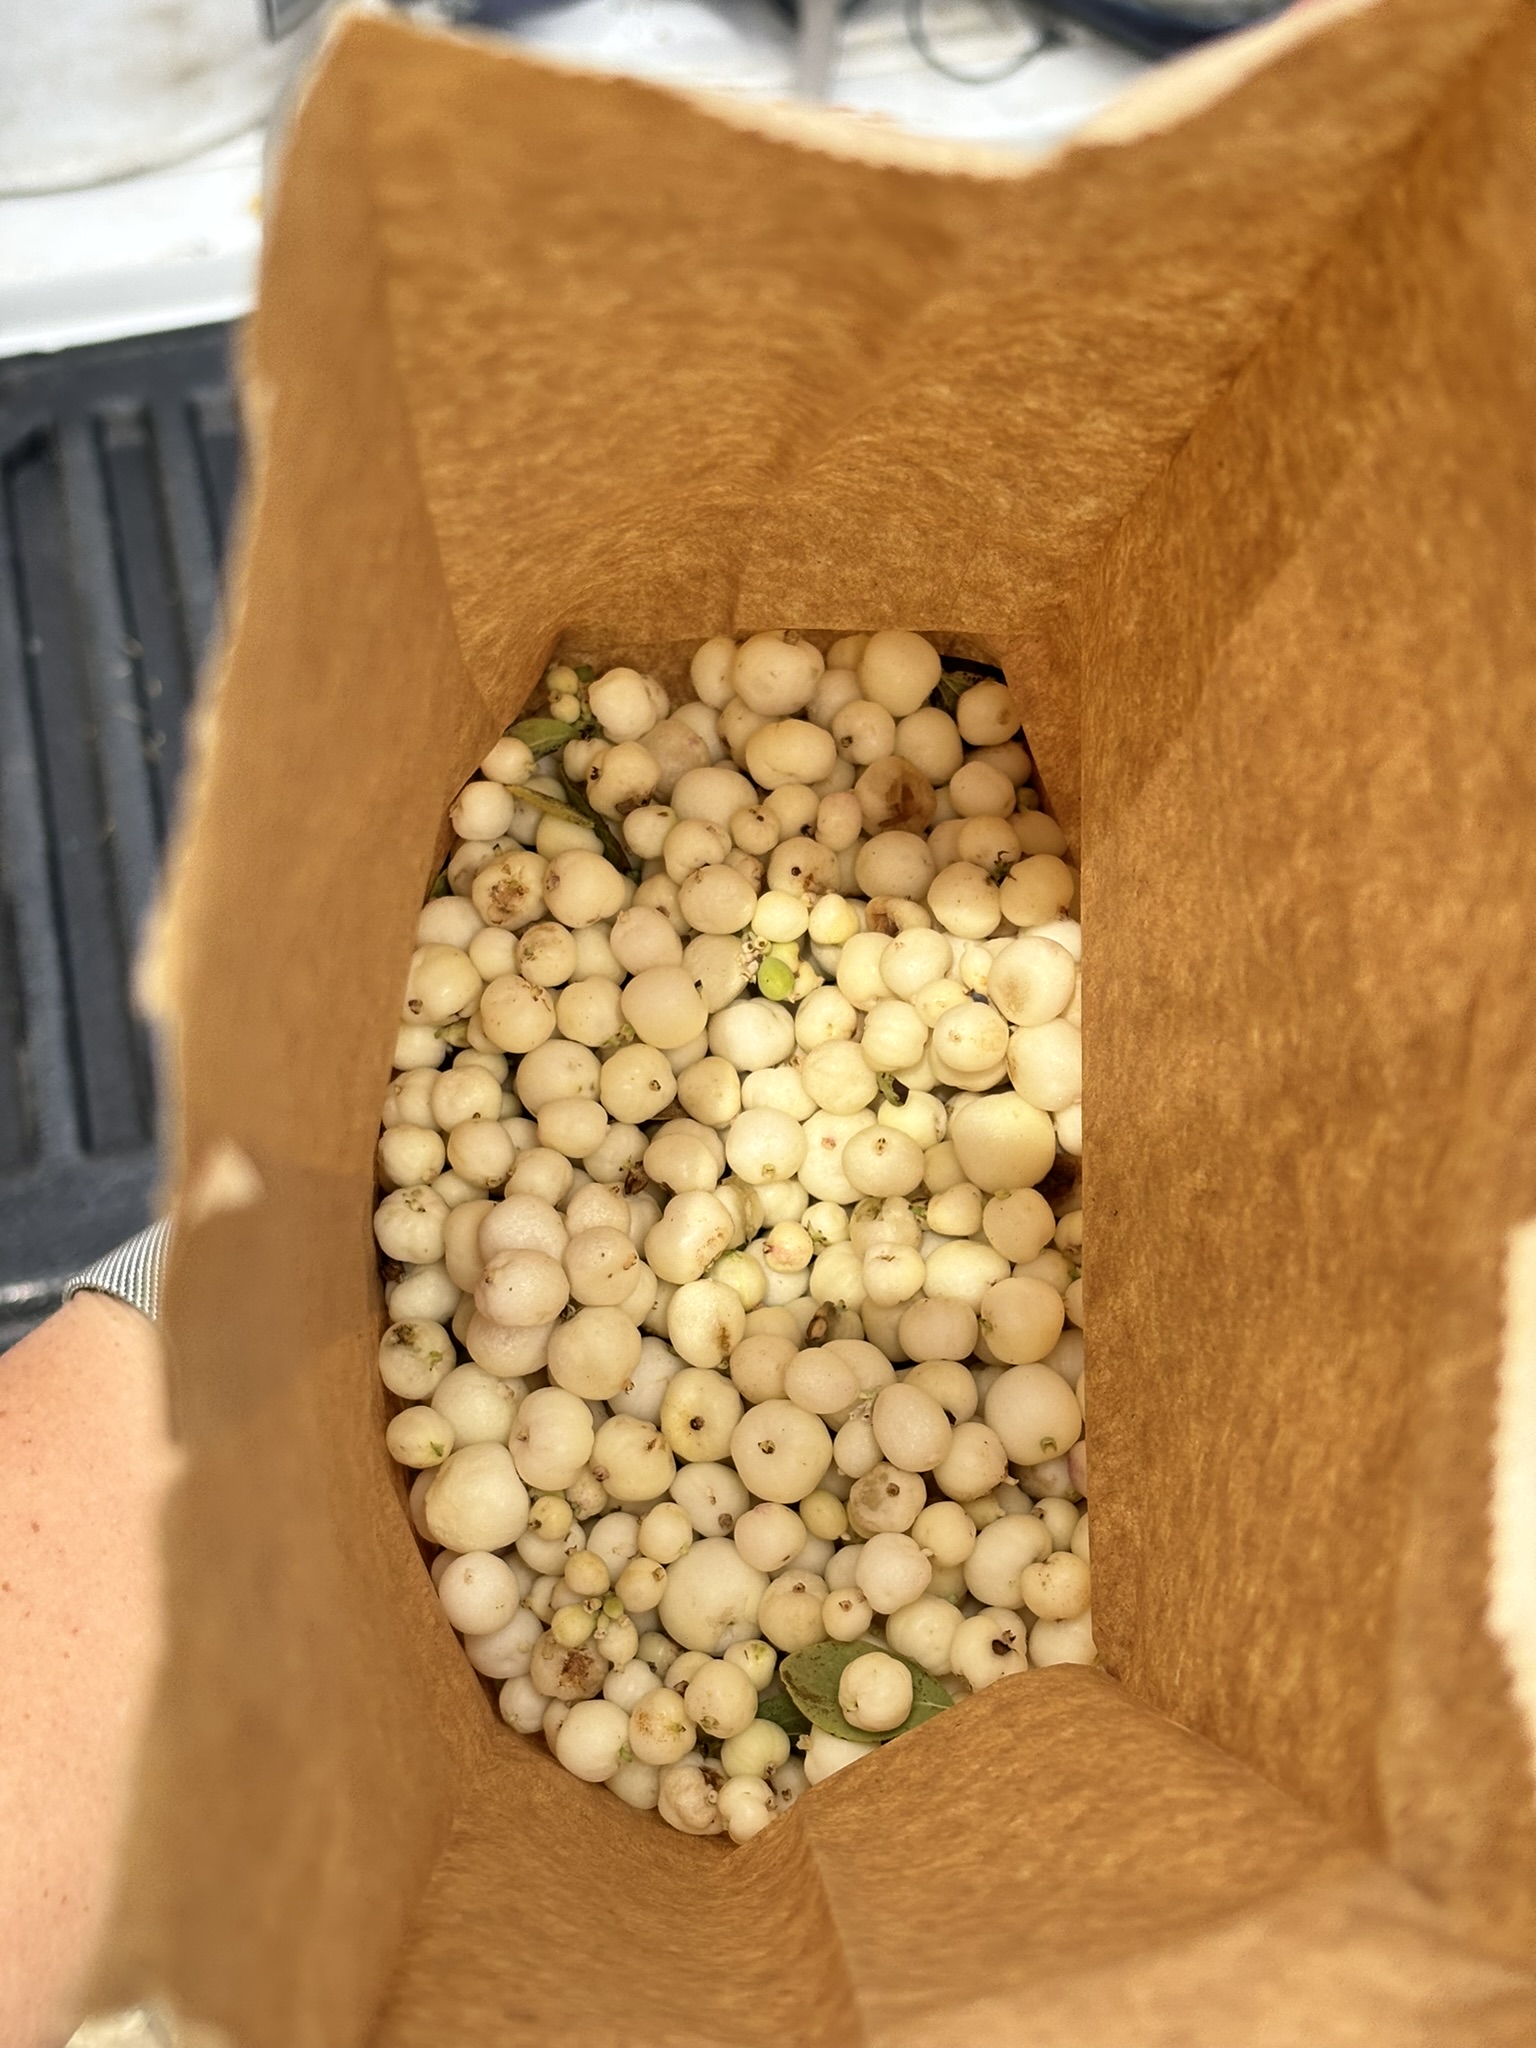
One of my favorite seeds to collect has been Oregon grape. By the end of July the thick, leathery leaves had turned a fiery orange and the pale green clump of berries darkened to a beautiful matte blue. When collecting the berries, they make a satisfying “click” when pulled from their stalk. After awhile I’d have a paper bag slumping with the weight of all the berries.
Other berries we’ve collected have been kinnikinnick, snowberries, and black currants.

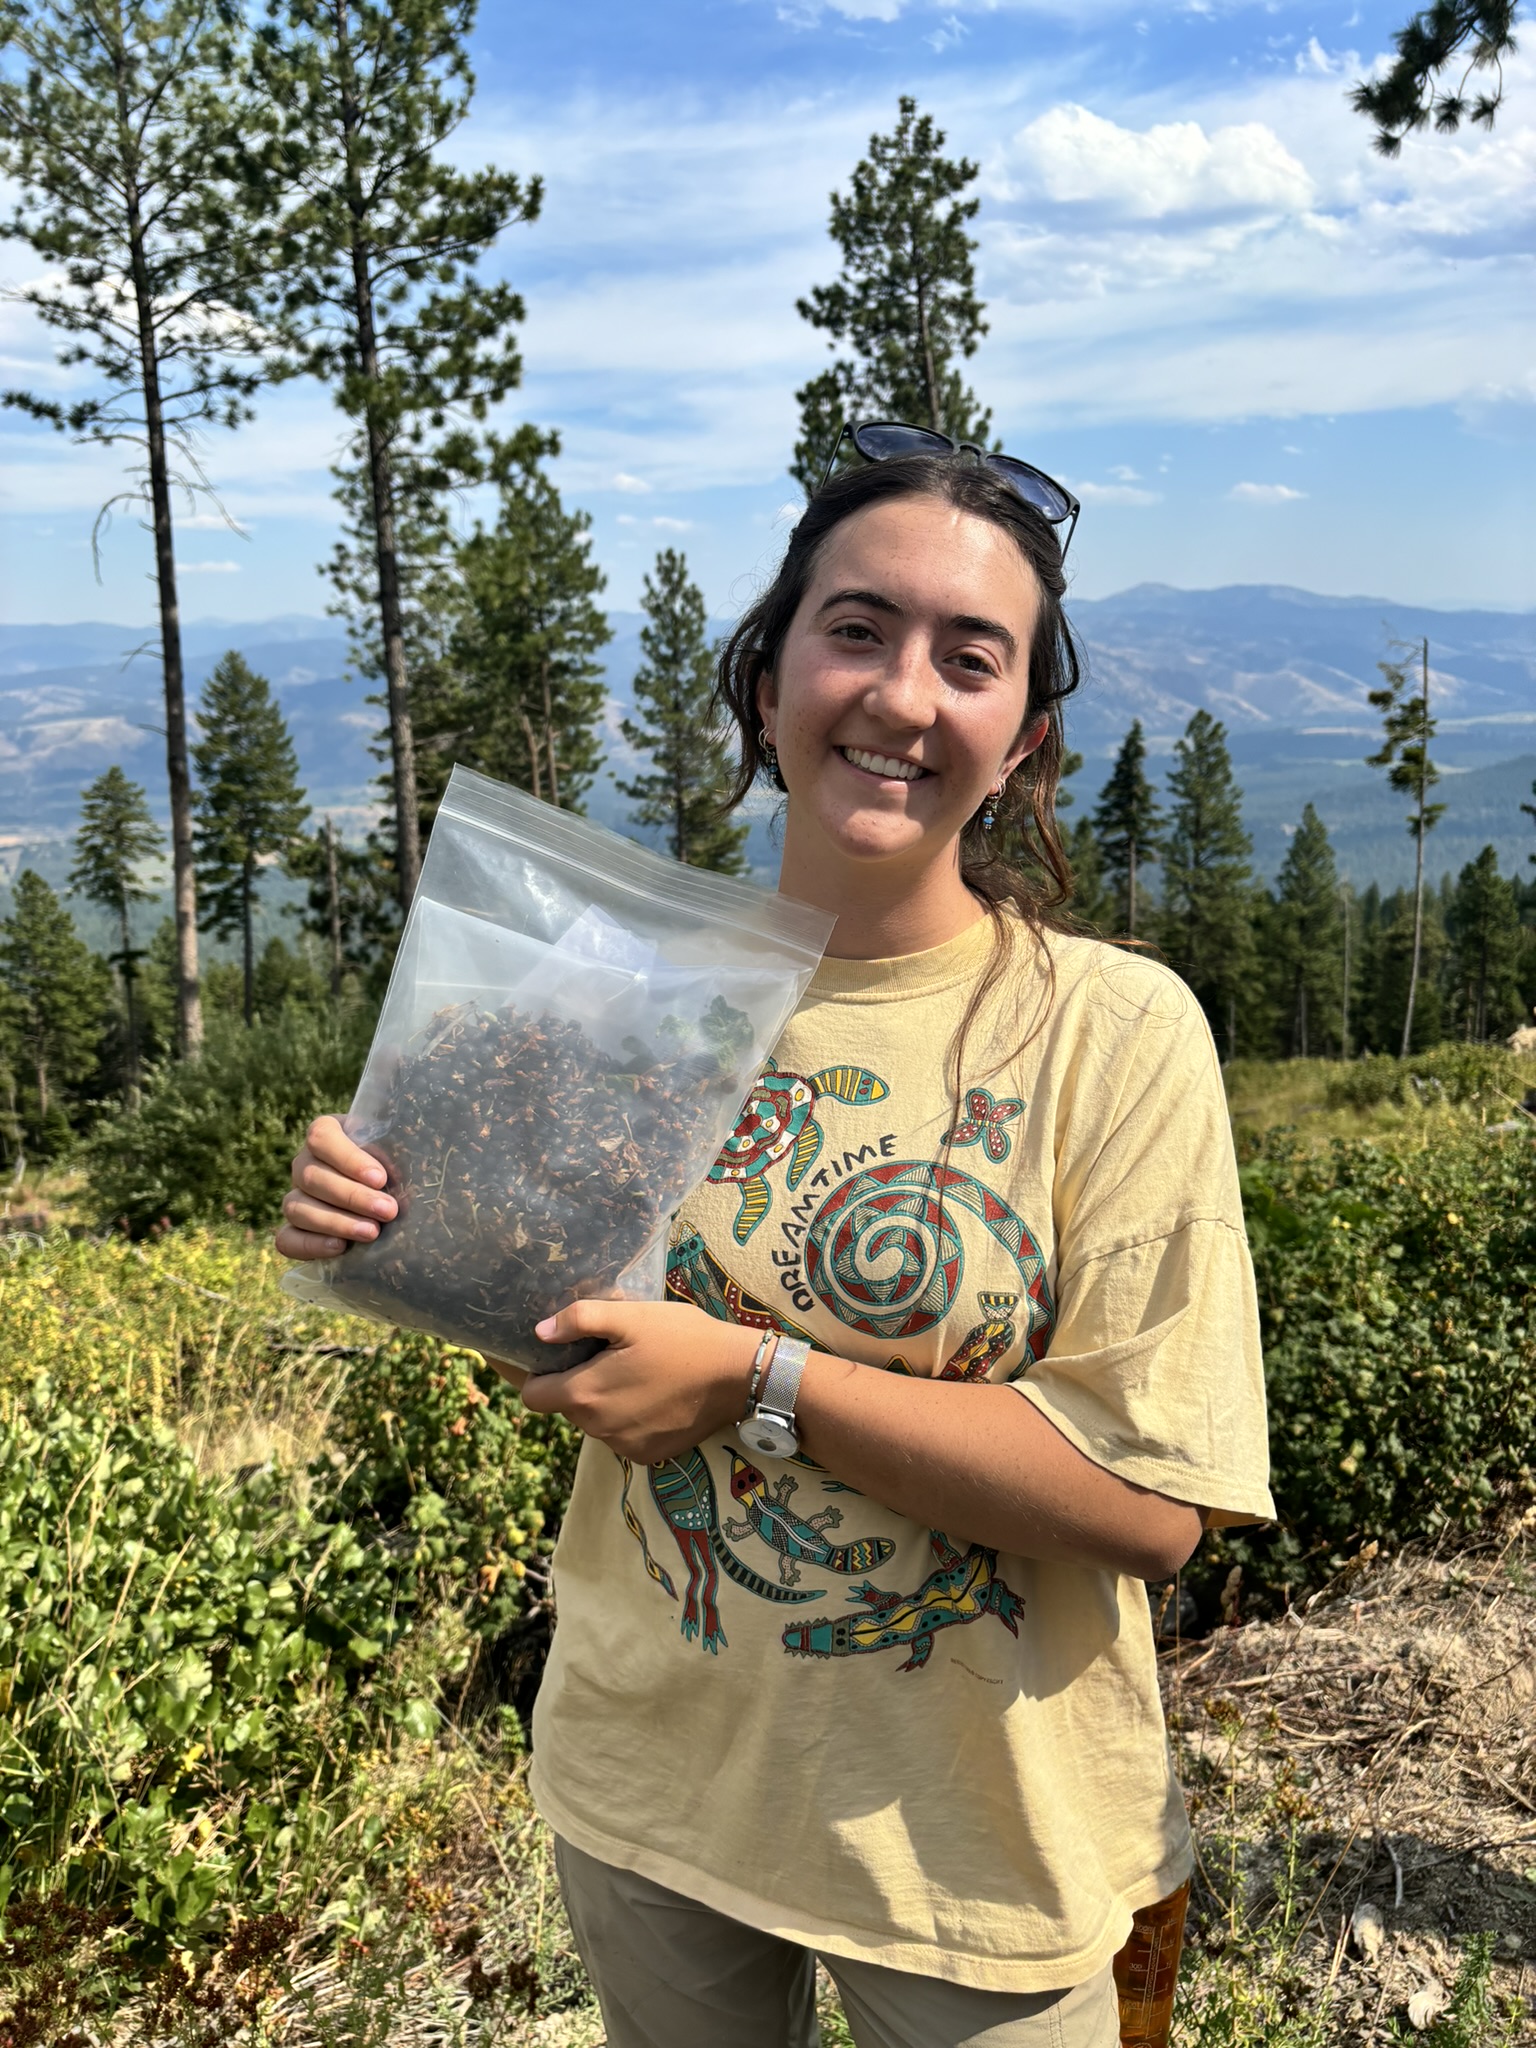
Our first priority for seed collection are species in the East Bulk seed mix. This mix is a new iteration of the Seed Transfer Zone seed mix, which was previously used for revegetation seeding. Both the East Bulk and Seed Transfer Zone seed mixes are full of “work horse species” that are ideal for colonizing disturbed land and making it more suitable for other species to grow later. For the East Bulk seed mix, seeds are collected across multiple forests and grown out at the Coeur d’Alene nursery with the goal of increasing genetic diversity of seed collections.
One thing that is somewhat frustrating about seed collecting is the amount of paperwork required for each seed collection. On our tablets we make a point or polygon on the map and fill out information about the watershed, aspect, elevation, collection purpose, and associated species. Then we fill out a FACTS form which is used to help determine funding and to be able to connect the seed collection to the point on the arcGIS map. Then we fill out a Short Form which is sent with the seeds to the nursery in Coeur d’Alene. We also fill out a tag to put directly on the bag so we can keep track of them as they pile up in the office. While it does take awhile, I see how useful it can be to have multiple ways to keep track of a bunch of information.
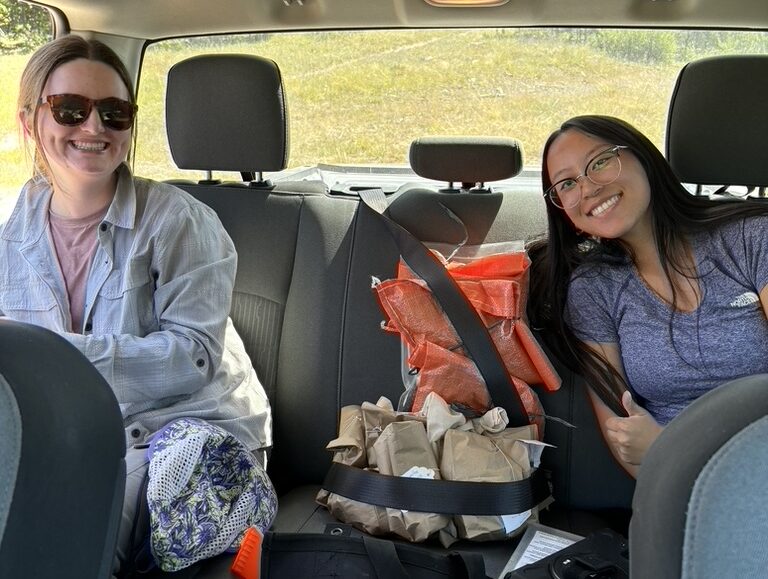
We have also been doing some cross training with other departments this month.
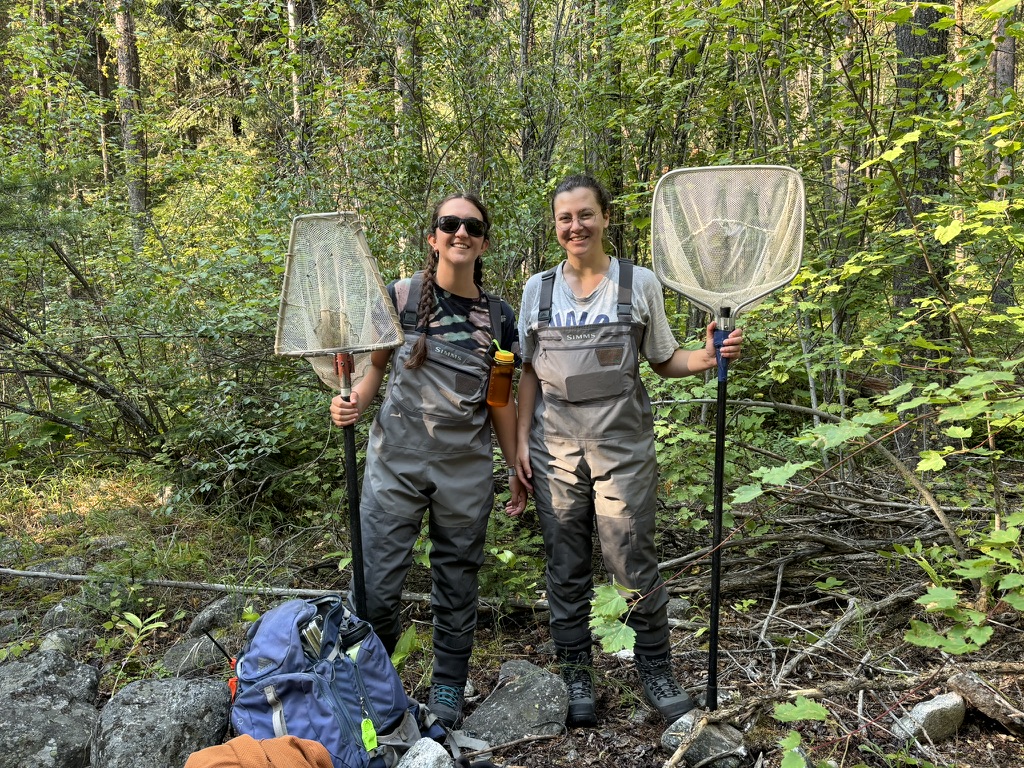
With hydrology, we went electrofishing, which is one method for surveying for fish. We were doing a general presence-absence survey to see which species were in the stream and got measurements for the biggest and smallest fish of each species we caught. Electrofishing uses metal wands that shock the fish and allow a netter to scoop them up. We learned that many creeks in the Bitterroot mountains are very low conductivity because the dissolved minerals from granite do not ionize. In medium or high conductivity water, the fish get attracted to and “frozen” in the ring of the wand. But in low conductivity, the shockers don’t work that well, so we improvised by stunning the fish with the shockers and using our nets to block parts of the stream.

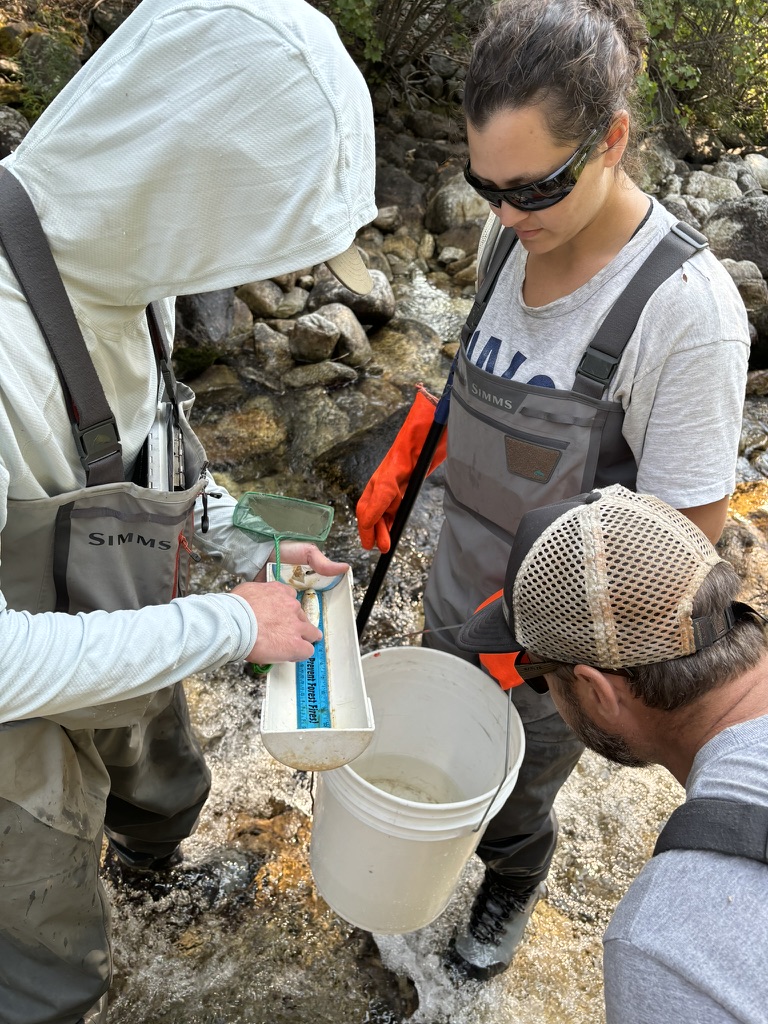
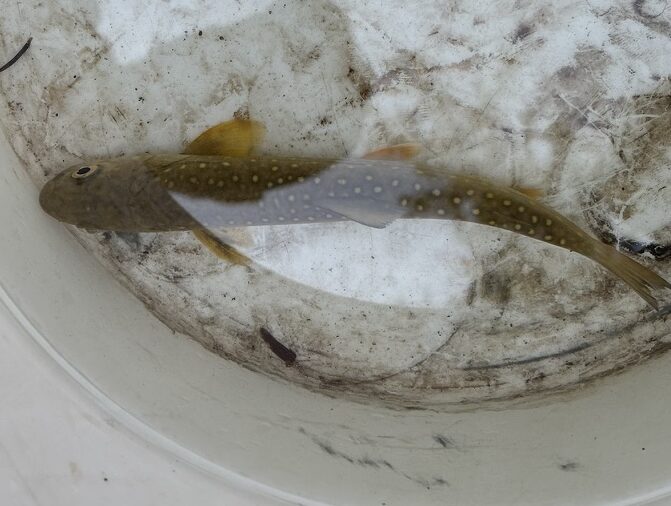
We were very excited when we caught a bull trout, which are a threatened species. According to the US Fish and Wildlife Service, bull trout live in cold, clean, complex, and connected habitats, which includes mountain streams and Bitterroot River. The hydrologists told us that some bull trout stay in one stream their whole life, and others are migratory. But, the rising temperatures of the streams, dams and water diversions, and water usage that drains the river damages bull trout habitat. Now these fish only rarely occur in the Bitterroot river. However, the one we caught was not messing around—while in the bucket it tried to eat another fish!
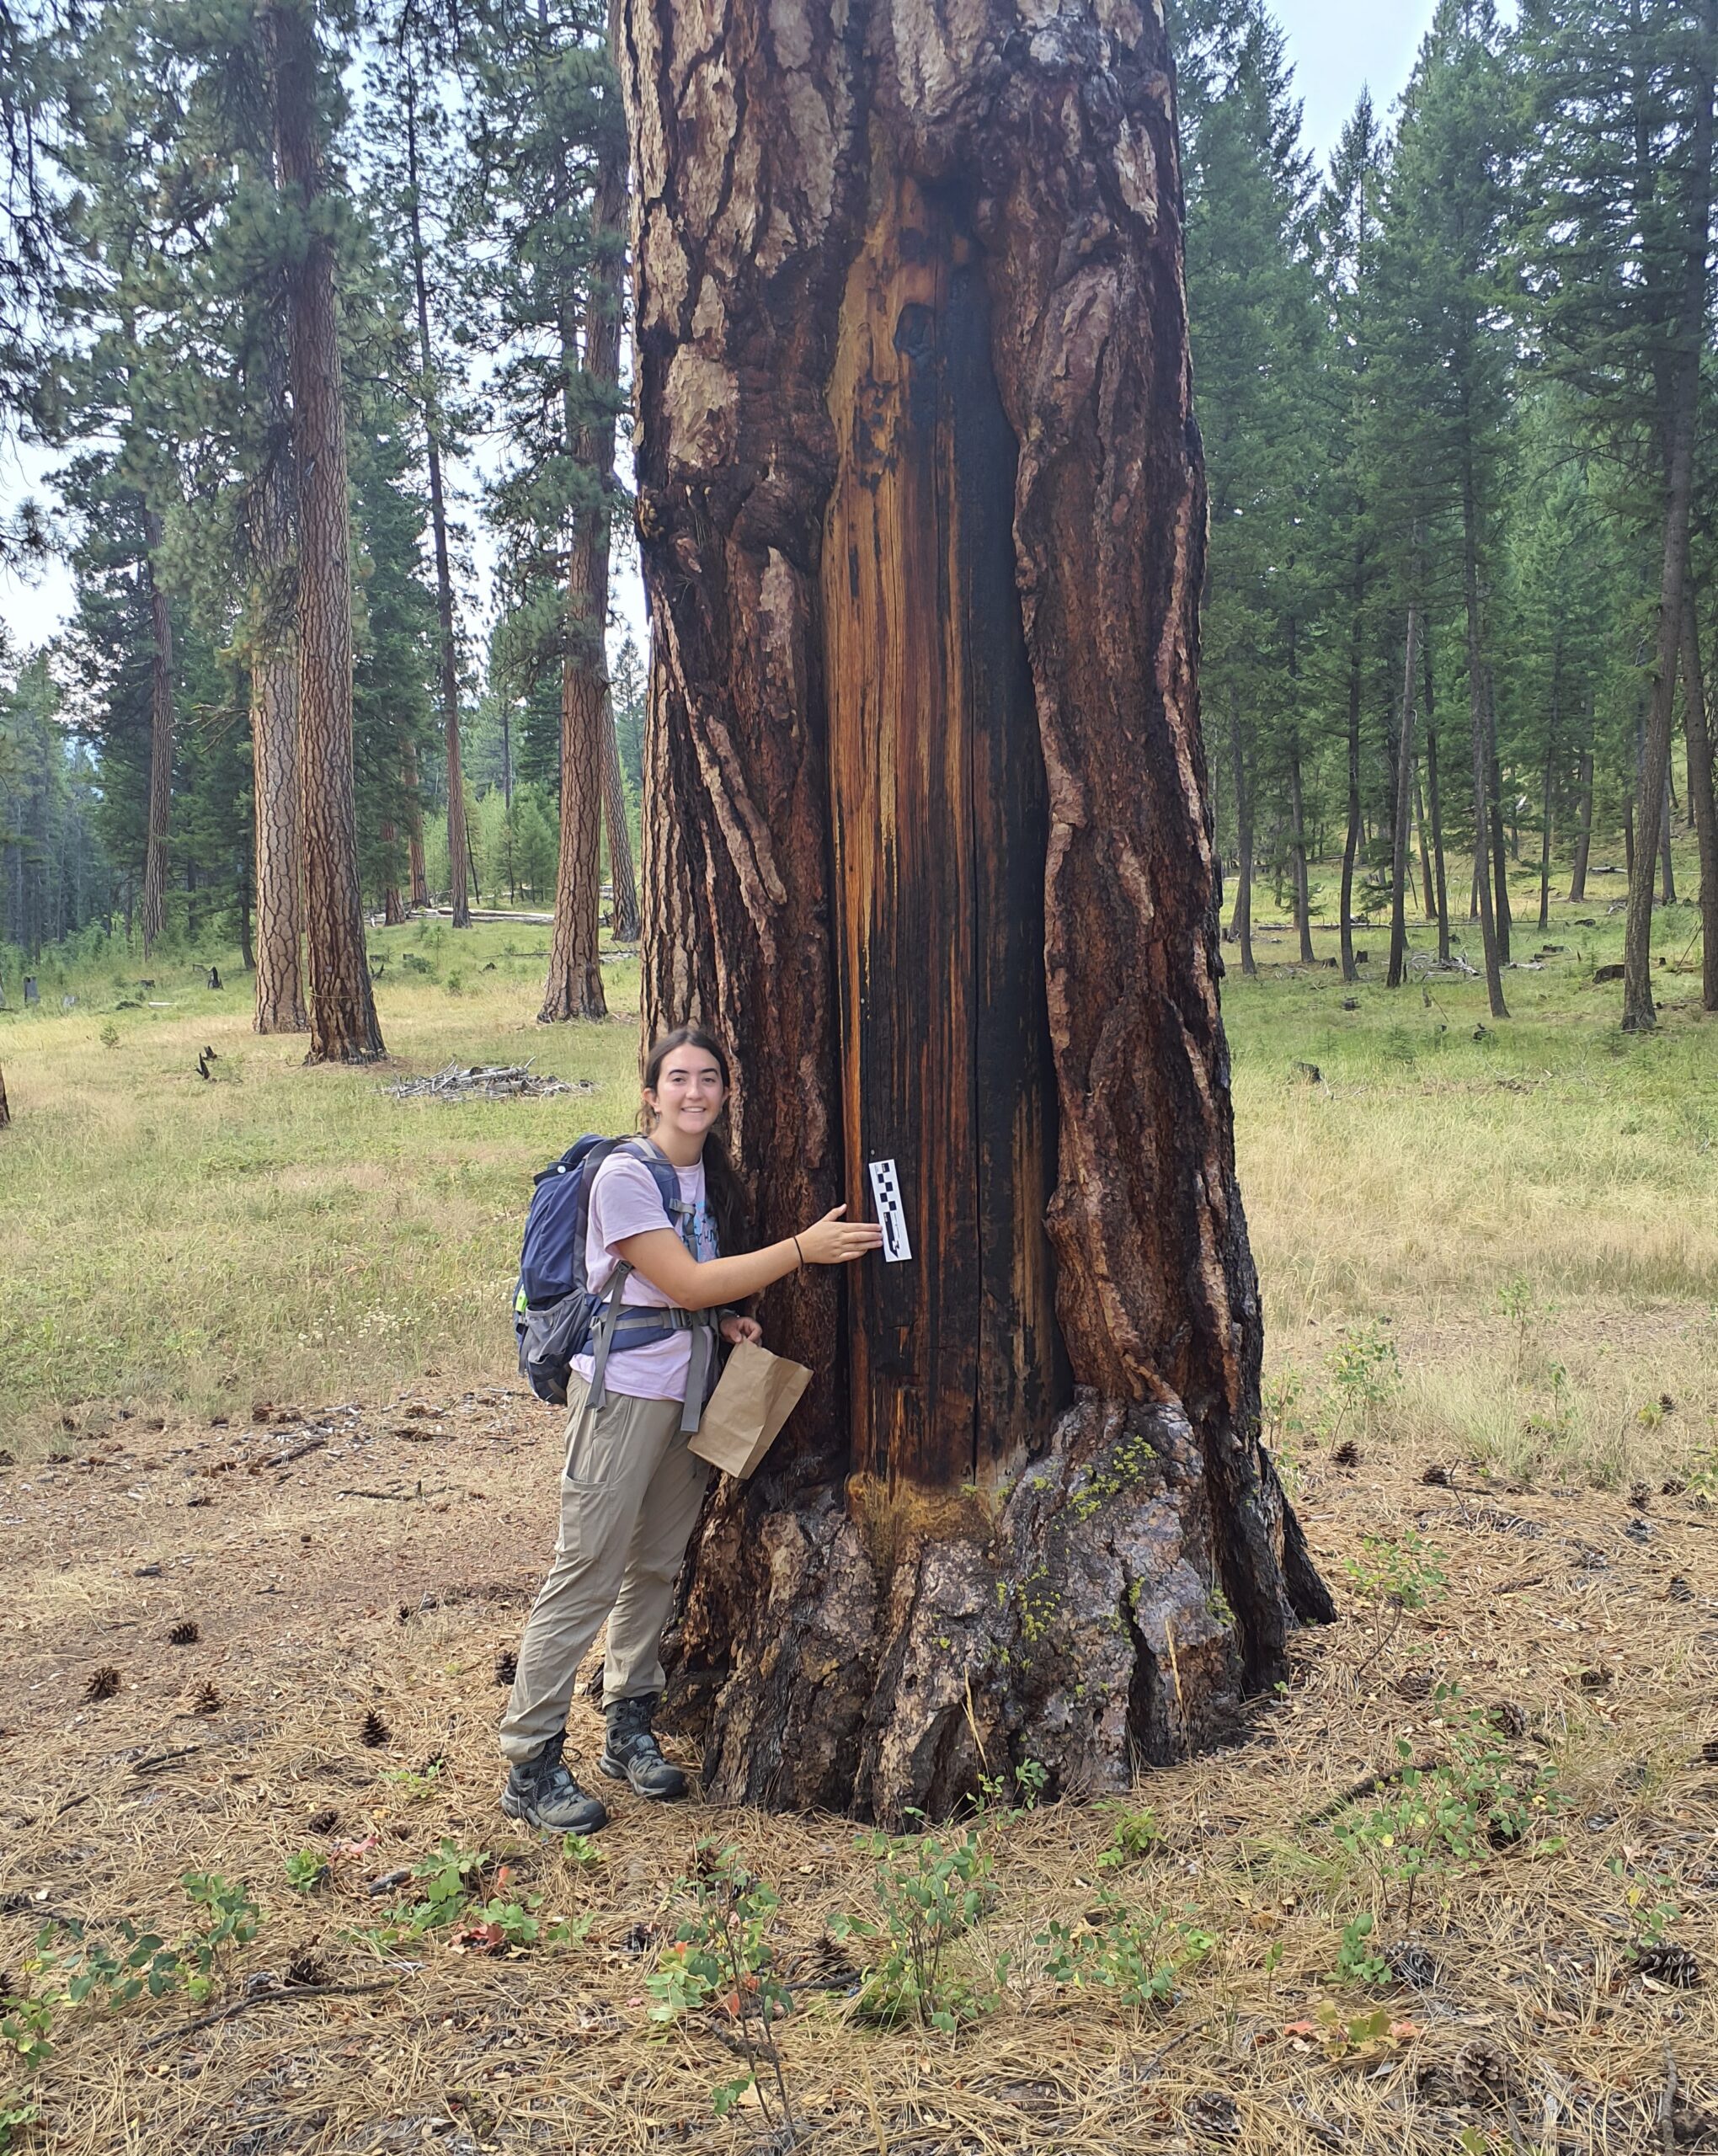
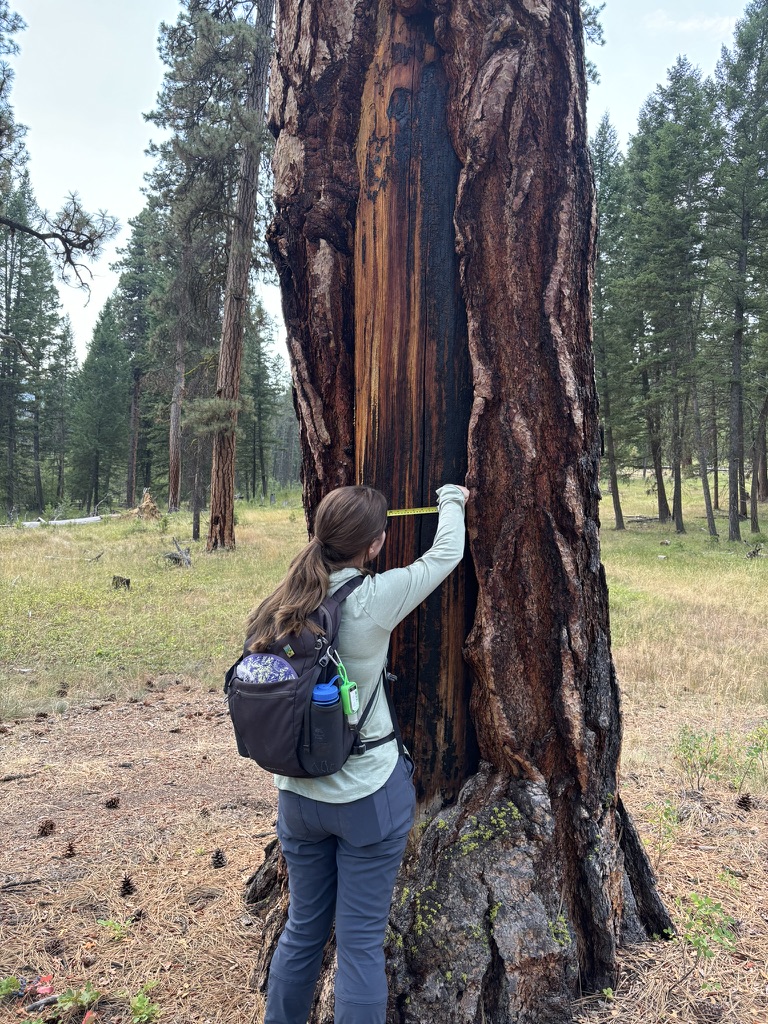
Our other cross training was with archaeology, surveying cambium peeled trees. According to Meghan and Matt, the archaeologists we went out with, the trees at this site were most likely peeled by the Bitterroot Salish and Nez Perce between the 1860’s and the 1910’s, though this practice has been around for thousands of years. In the spring they would peel the outer bark from the tree and eat the inner cambium layer which is a rich source of carbohydrates. For the survey we measured tree diameter at breast height, the length, width, and depth of the scar, aspect, and tree condition. Some trees also had test scars and cut marks that we also measured.
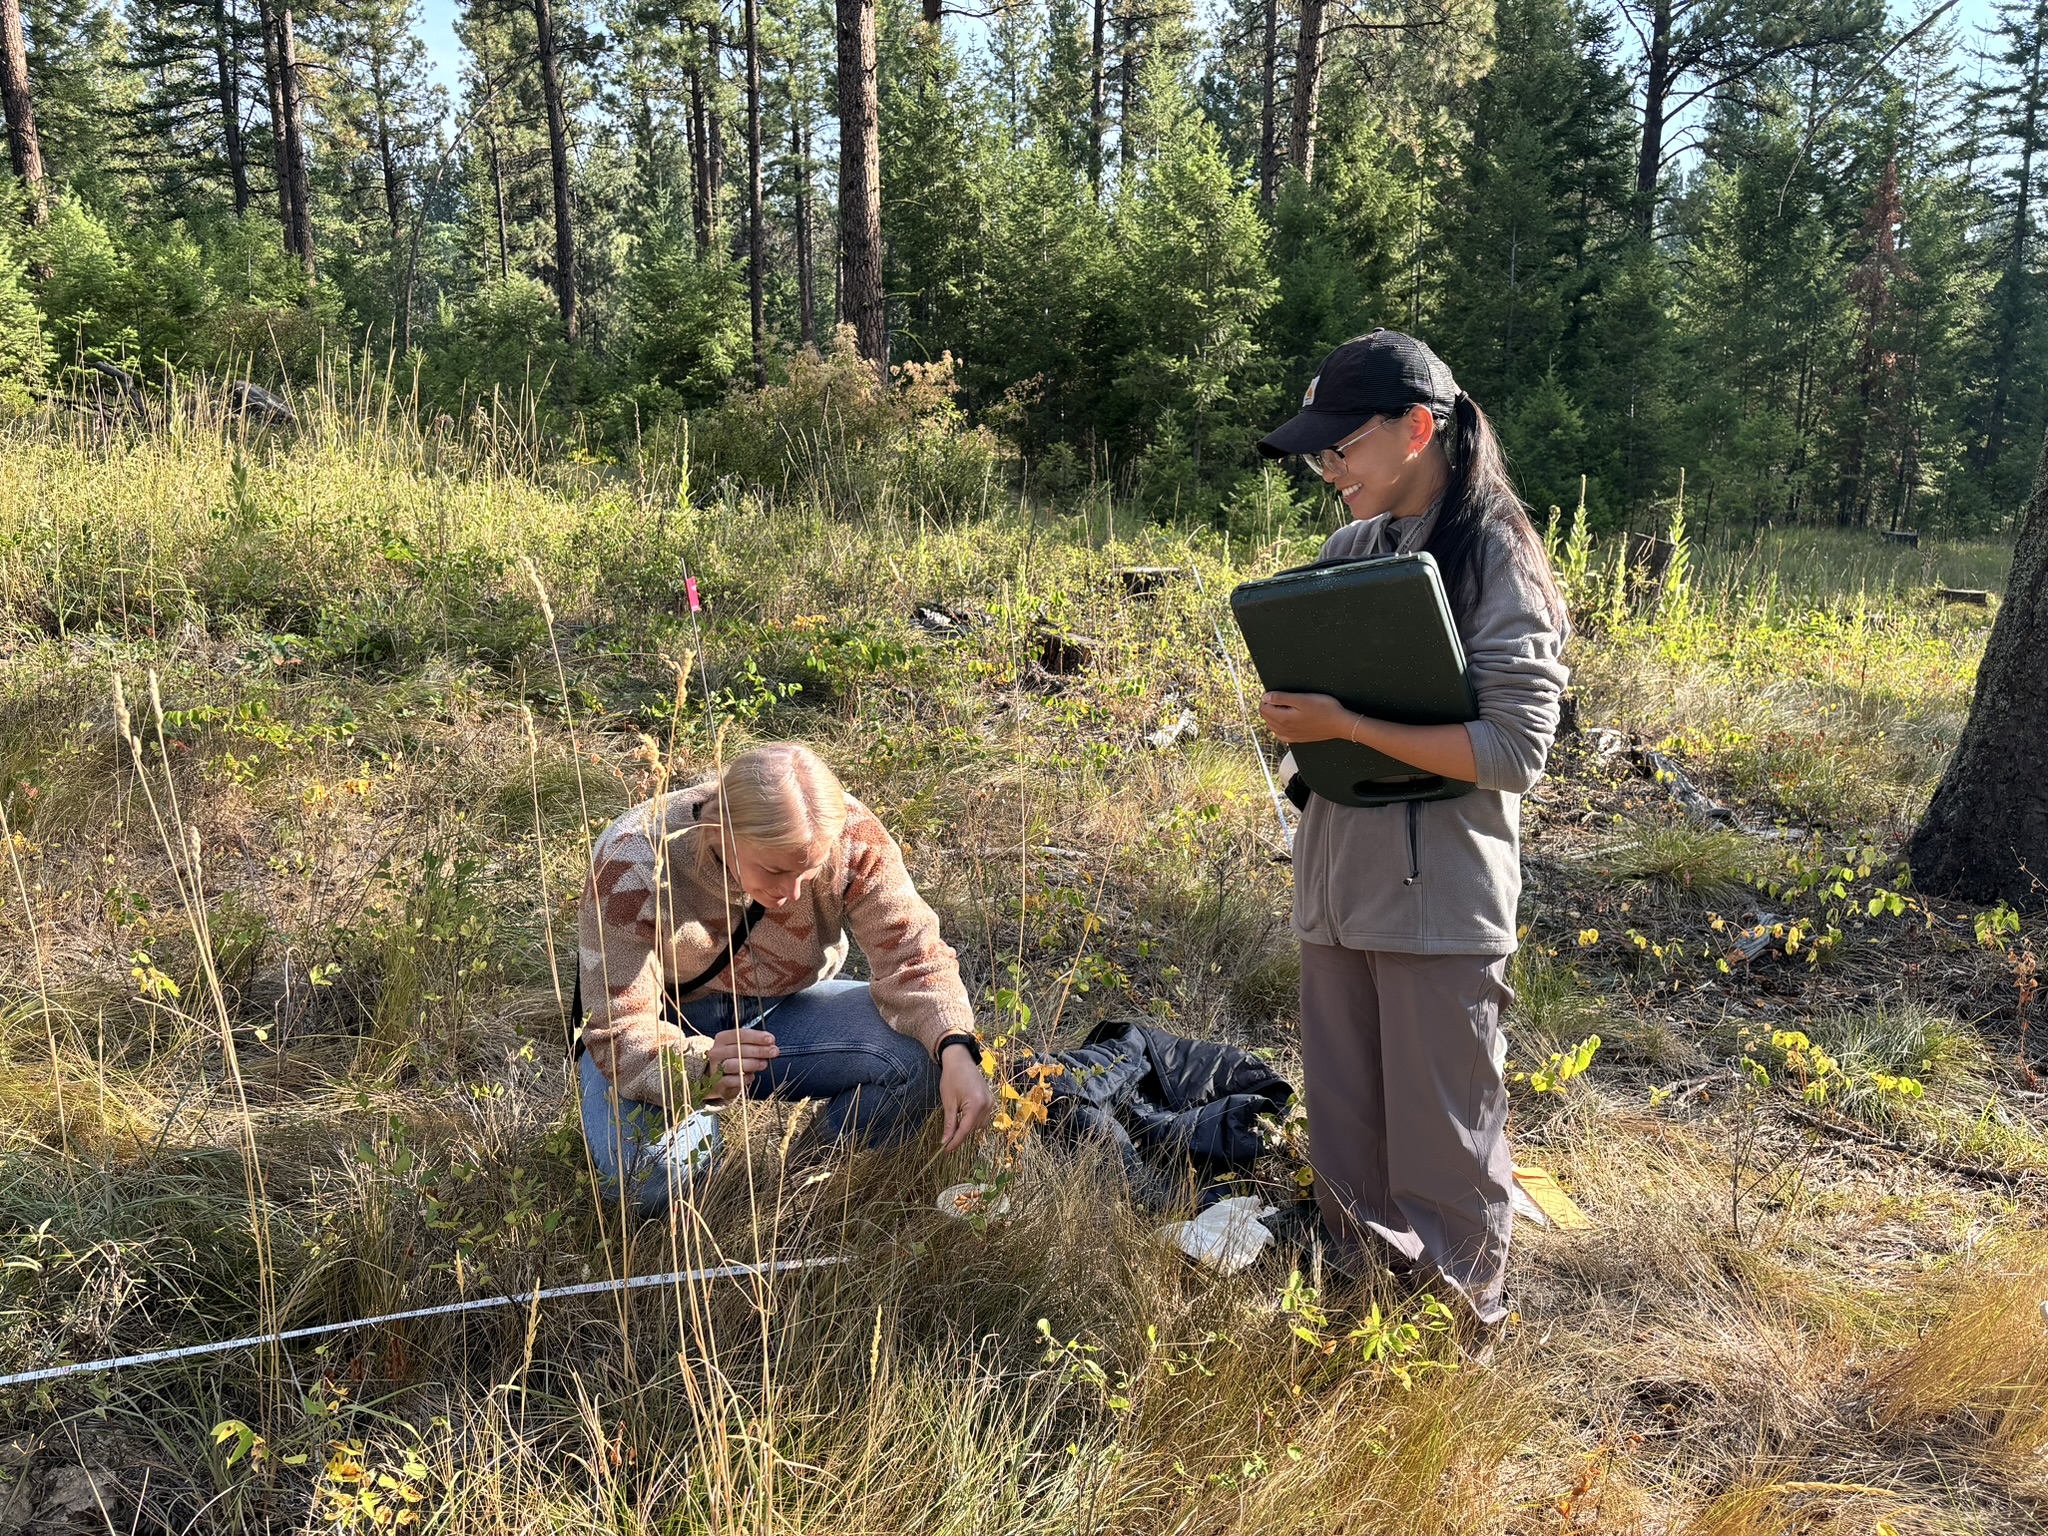
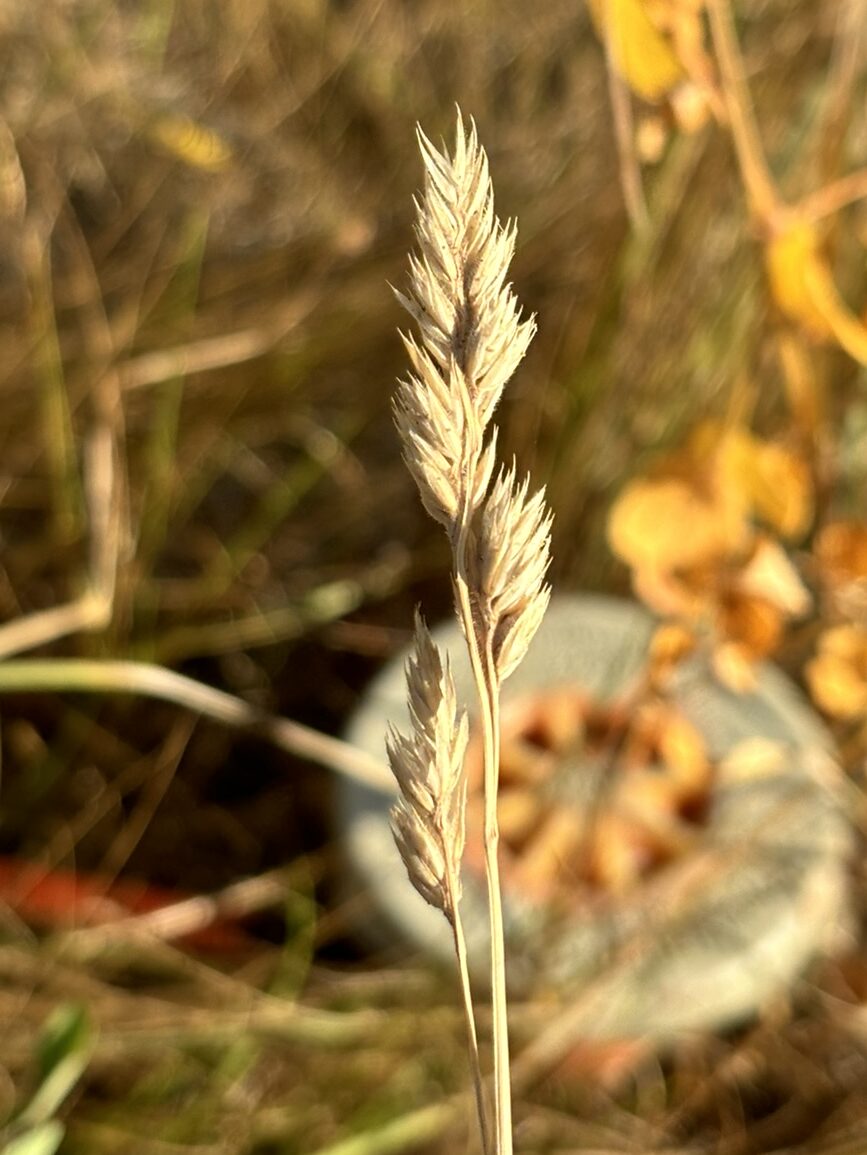
The other main project we have been working on is vegetation monitoring. This includes decommissioned roads that have been seeded as well as landings and burn piles from logging that have been turned into pollinator islands. We use line-point intercept monitoring to evaluate vegetation growth. This involves setting up measuring tapes between two set points marked with rebar, then at each foot, dropping a “pin” which is a long thin rod. We record the canopy above the pin, the vegetation that hits the pin, and the ground cover. This data is then used to determine the success of the seeding or planting, and to keep track of erosion.
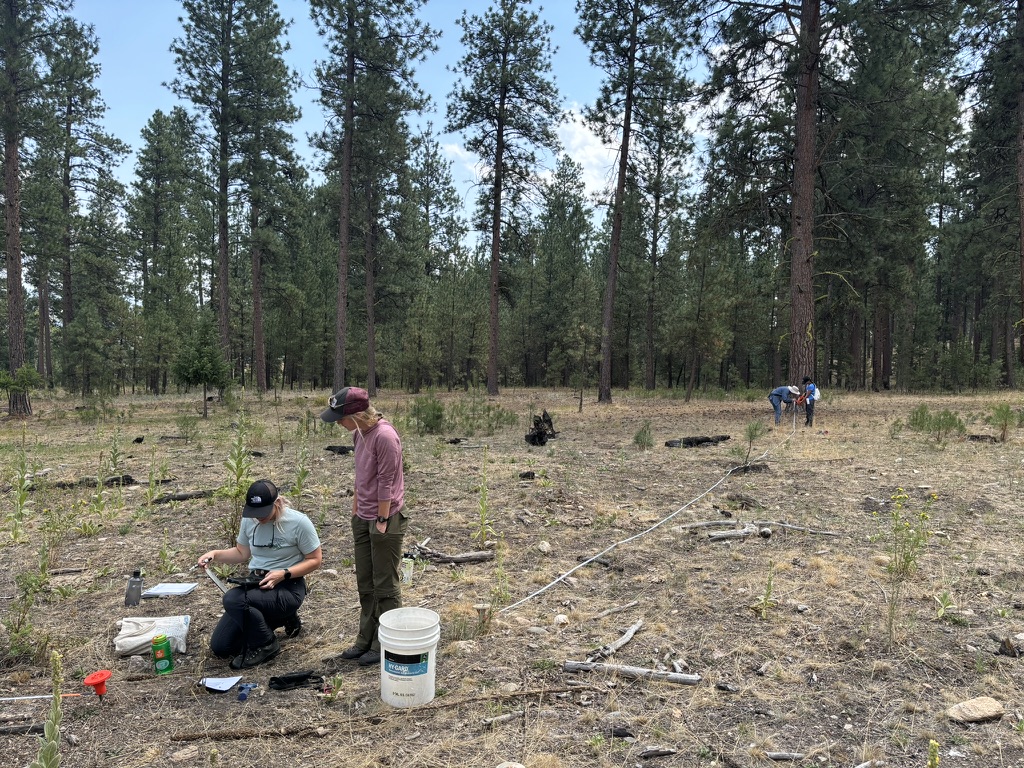
One thing I find both difficult and enjoyable about monitoring is the challenge of determining different species from limited information. Because we started monitoring in August, some plants have started to senesce and shrivel, or they are still vegetative and have not yet produced any flowers, which makes them difficult to identify.
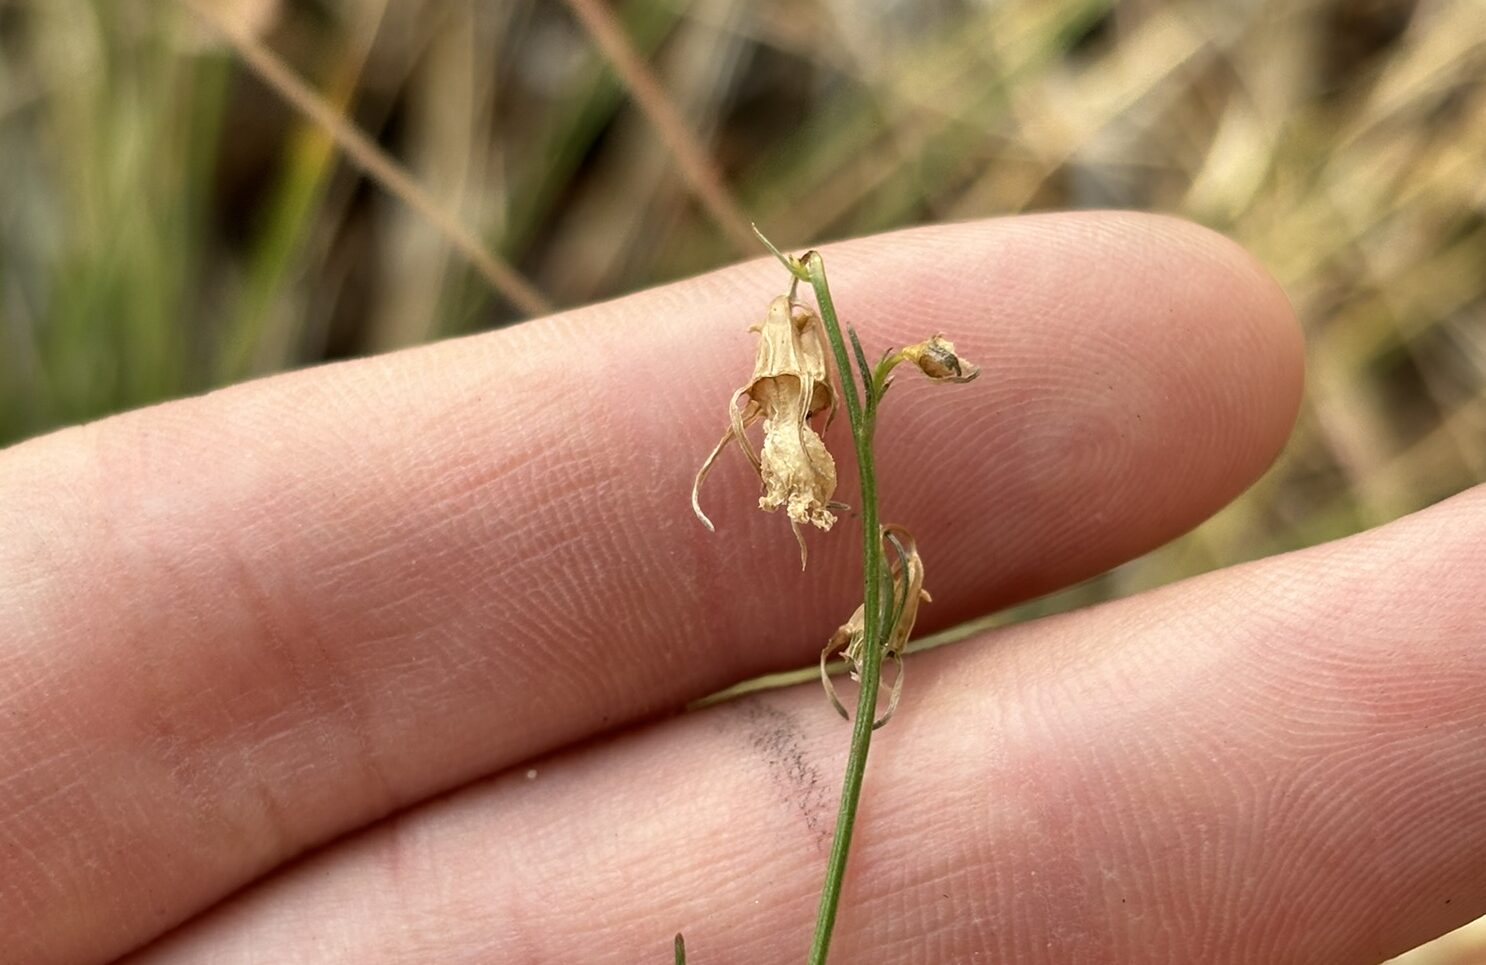
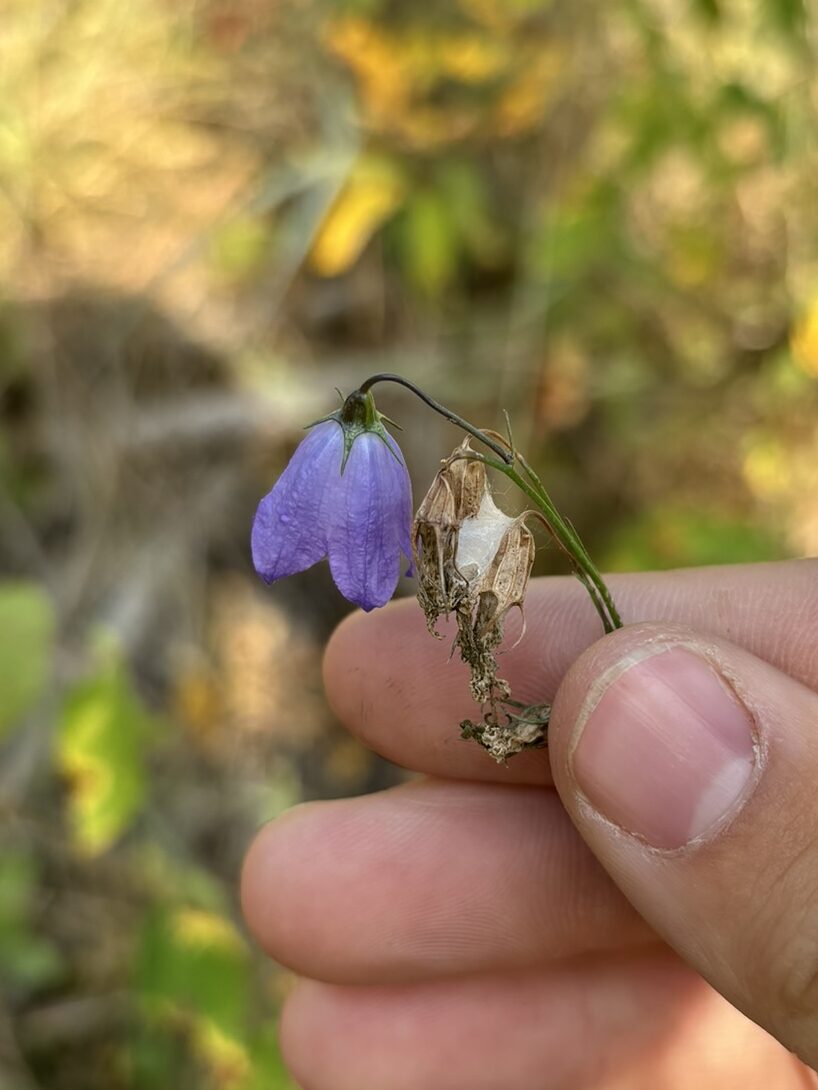
This makes monitoring kind of like a scavanger hunt. While monitoring a pollinator island, I came across this shriveled plant. As I investigated its dried form, with its creepy, curling petal-bits, nothing came to mind. I was stumped. I marked it as an unknown and continued monitoring. Later, I came across a harebell that solved the mystery. It had both shriveled and young flowers, confirming that the weird spikey flower had in fact been the soft and delicate harebell.
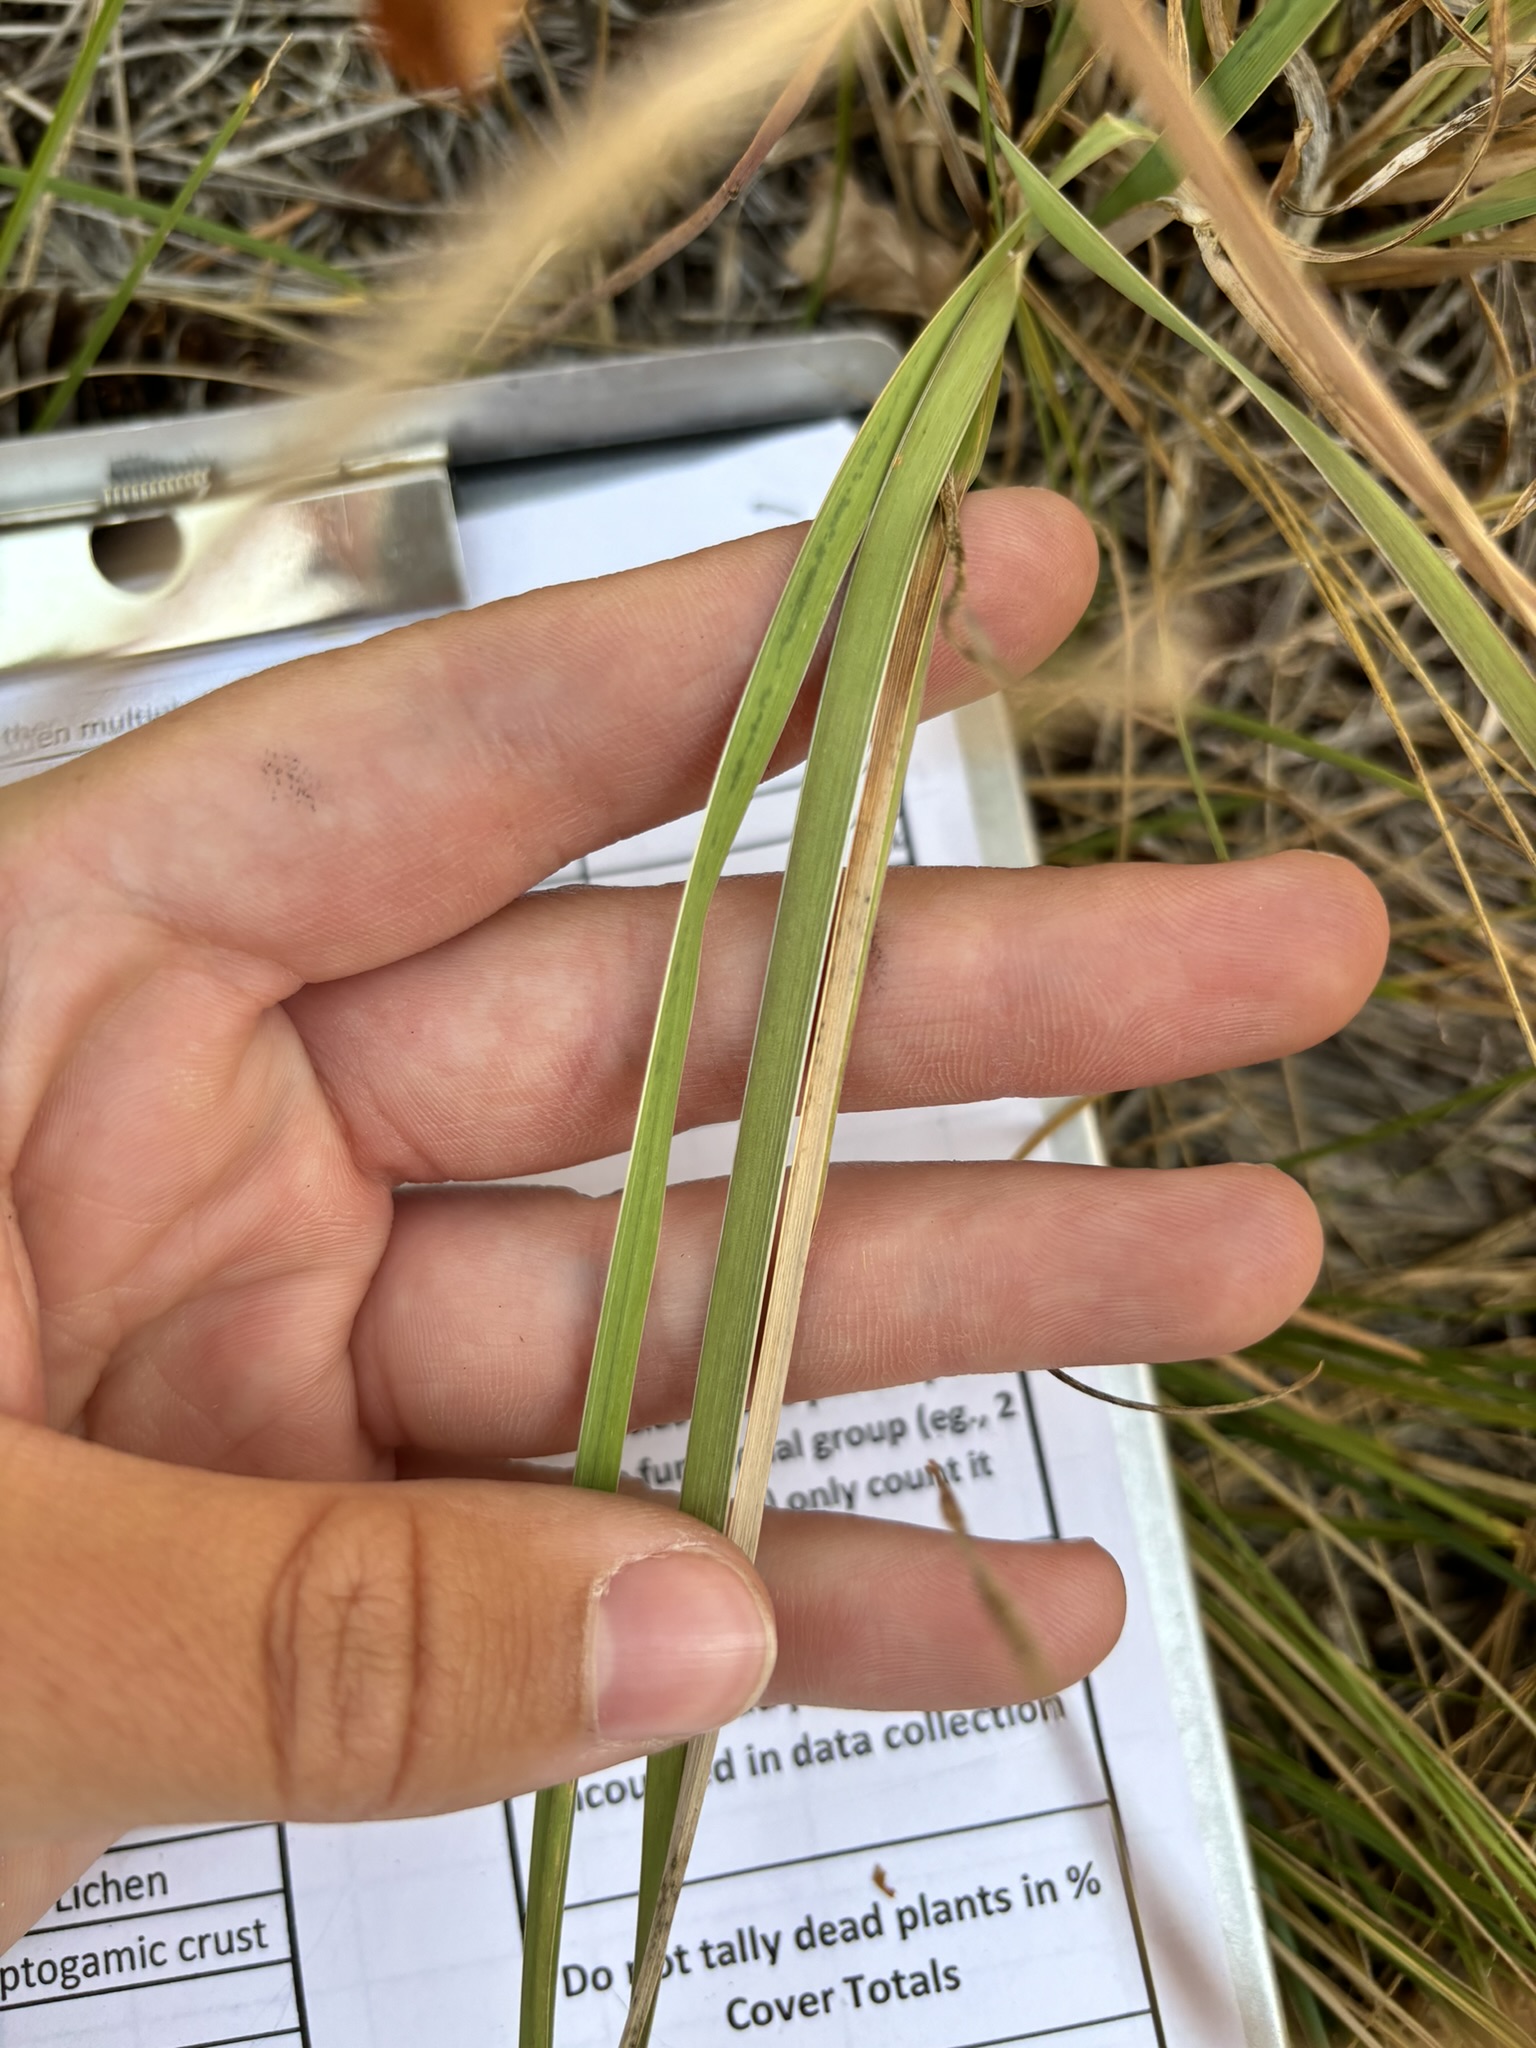
Many of these sites are also grazed, so we end up trying to sort through different clumps of stubby, dried grasses. My favorite monitoring-scavenger hunt example was a mysterious, soft grass. It had long, bright green leaves that were larger than other species nearby. When I bent down to investigate, I noticed its distinctly soft leaves. It wasn’t smooth like pinegrass or fuzzy like mullein is, but very tender. But, there were no seed heads to tell me who it was. I felt the blades of different grasses around me, and none were nearly as soft as this mystery grass. I checked the clump multiple times to see if I missed any seed heads. I investigated the ligule to see if it might tell me something. Nothing. I resigned myself to marking it as an unknown.
When we finished with each transect line for that plot, we coordinated our different unknowns. This time we walked around the whole plot, searching for other clumps of the soft-leaved mystery grass. Eventually we found it. My co-intern Eliza spotted a large and drooping bunch of green. I felt it and there it was, the soft leaves! This clump did have its seed heads and with it we knew immediately that it was Orchard Grass. I had previously liked Orchard Grass because its seed head is distinct enough that I could immediately tell what it was. But I had taken its distinctness for granted and never noticed anything else about the plant. Now, I have another characteristic in my Orchard grass tool belt.
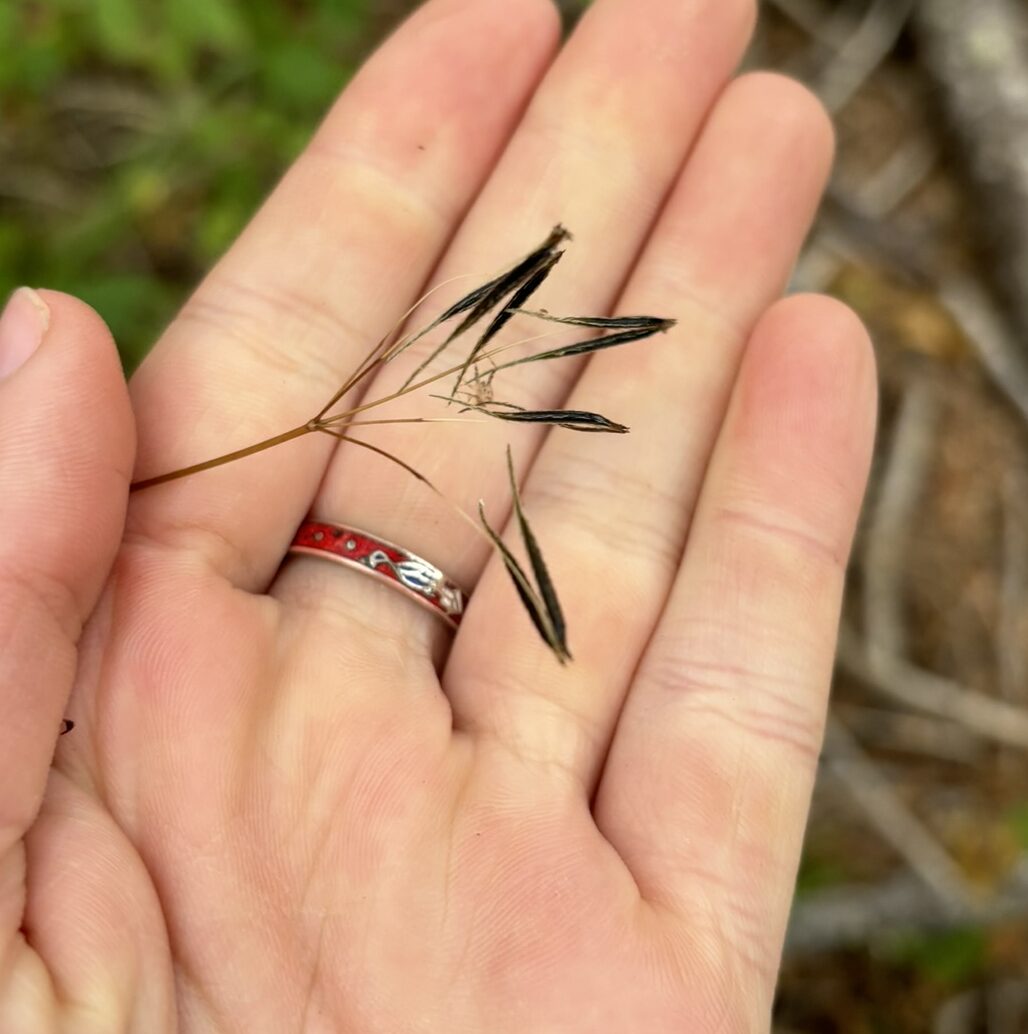
Monitoring has taught me to use a combination of small cues to tell which grass is which. I now can recognize Psuedoroegneria spicata for the blue tinge and the sharp angle at which the leaves extend from the stem, rather than just the distinct bent awns of the seed head. I now can reconize Koeleria macrantha for the “racing stripes” on the leaves rather than for its pretty, narrow panicle. Many of these characteristics are not even things I can easily articulate, but after many repeated exposures to the plant, some part of my brain is able to sort different shapes and colors of grasses that at the beginning of the summer would have all looked the same to me. While it is true that I am learning, it is also true that we have a long list of unknown grasses on our data sheets.
Overall, it has been another good month, and the cool days have me looking forward to fall!
– Cicely