Getting acquainted with Excel

Happy New Year! The past month has flown by quite quickly, much to my dismay, since that means less time left in the internship. I was very grateful to be able to travel home for the holidays – I got to see my family, my dog, and a little bit of snow!

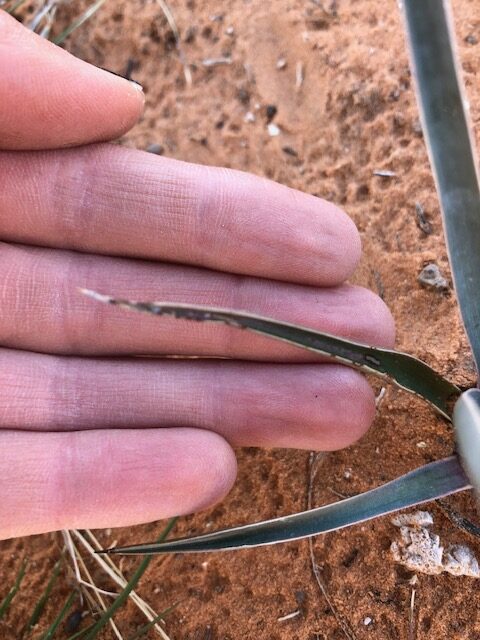
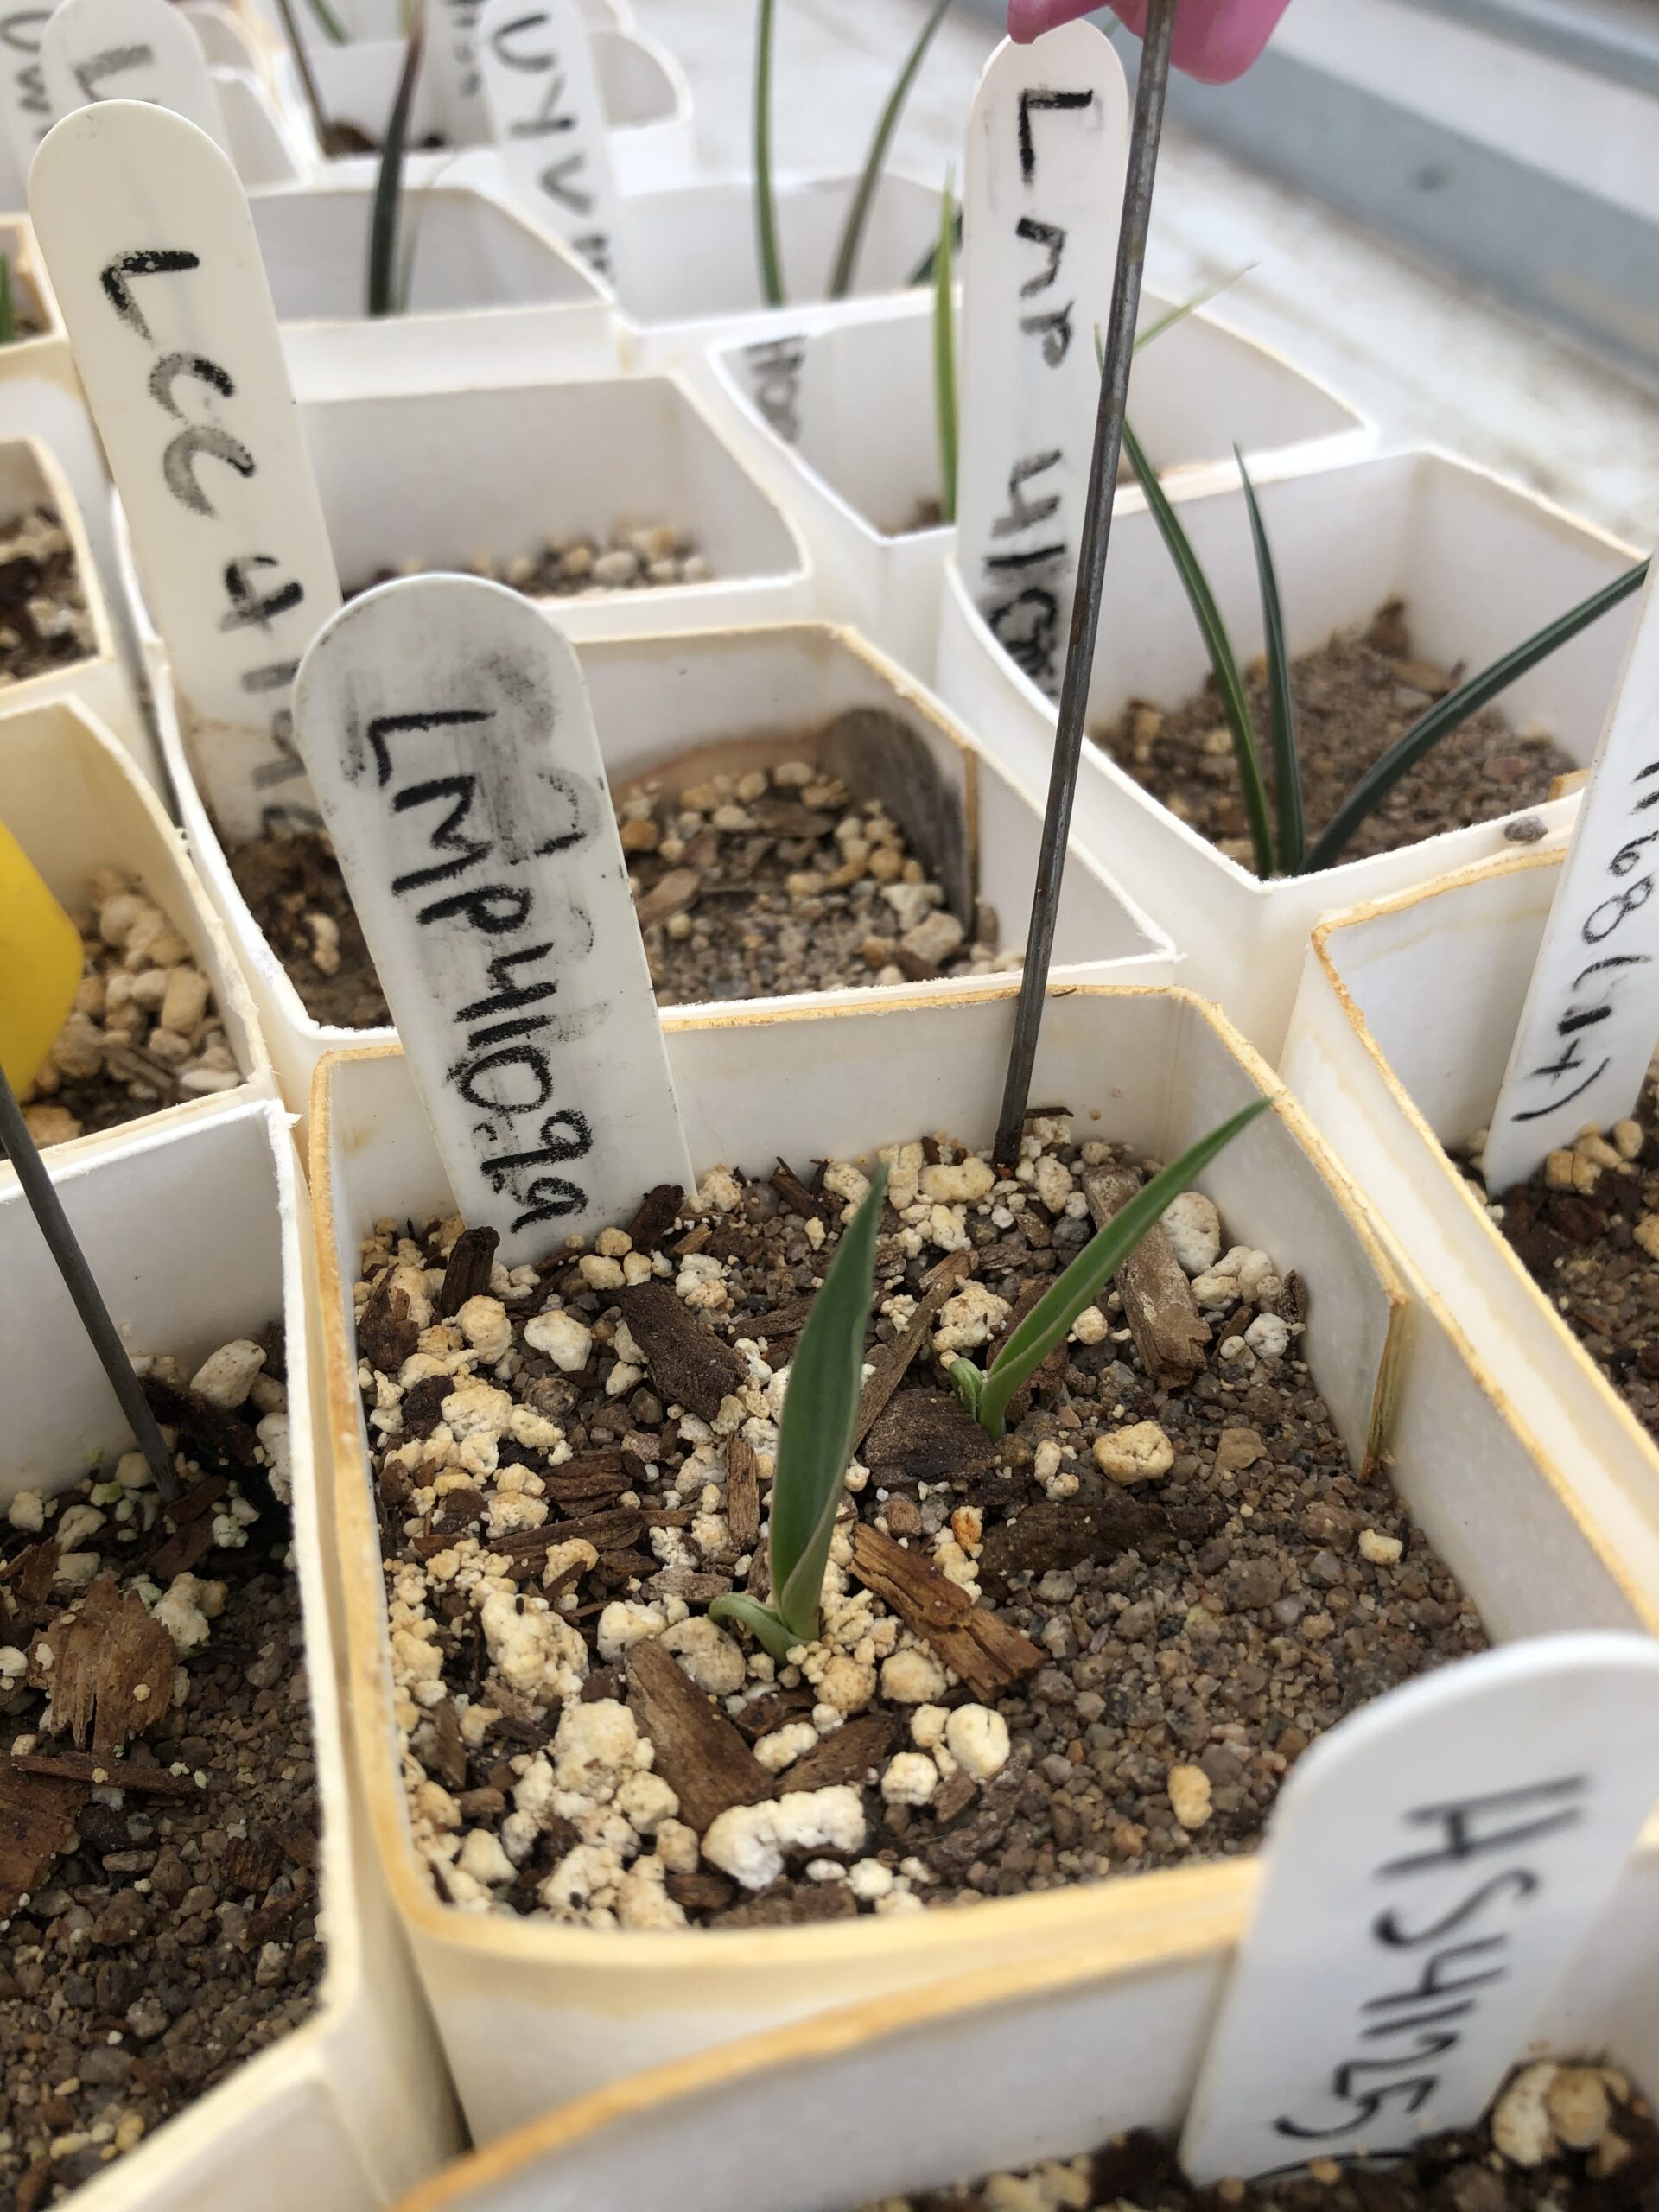
In the past month we’ve collected a lot of new data, which has given us much to do in terms of data entry. Near the end of December we completed an entire greenhouse assessment of the Joshua trees, which consisted of us checking each individual plant band to see whether a seed has grown, and if so, how many blades it has and the overall health of it. Even though we’ve been working with the Joshua trees a lot and have been seeing them pop up above the soil, I was still very shocked to find out that we have over 1,600 plants currently alive! The health and number of blades varied a lot, since seeds were planted at different times (some have been growing since September), but this assessment should give us an idea of which matrilines have been more successful in the greenhouse, which will aid us in future planting in the common gardens. From our minimal amount of data, we have noticed that one population in particular has not been very successful in the greenhouse (it currently only has 25 successful seeds, compared to other populations with 100+), which could potentially correlate to the conditions that seed is genetically attuned to – maybe it is meant to thrive in conditions that are colder or have a higher altitude? Maybe it finds the greenhouse to be too humid? This data could help the researchers understand why certain populations are more successful in certain gardens (and in the greenhouse) than others.

Two seeds were planted in the same plant band, and both have successfully sprouted!

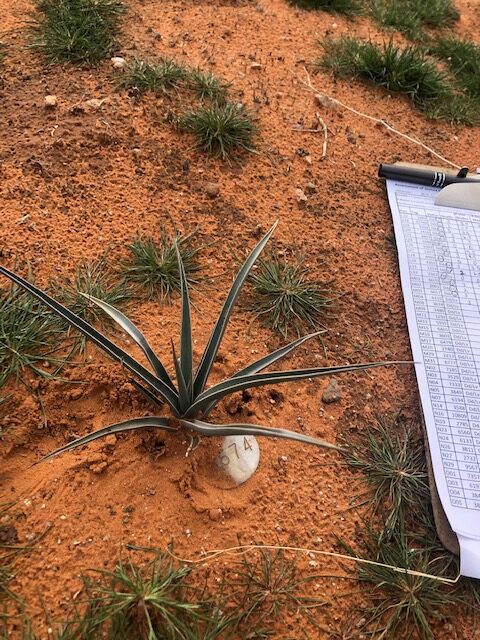
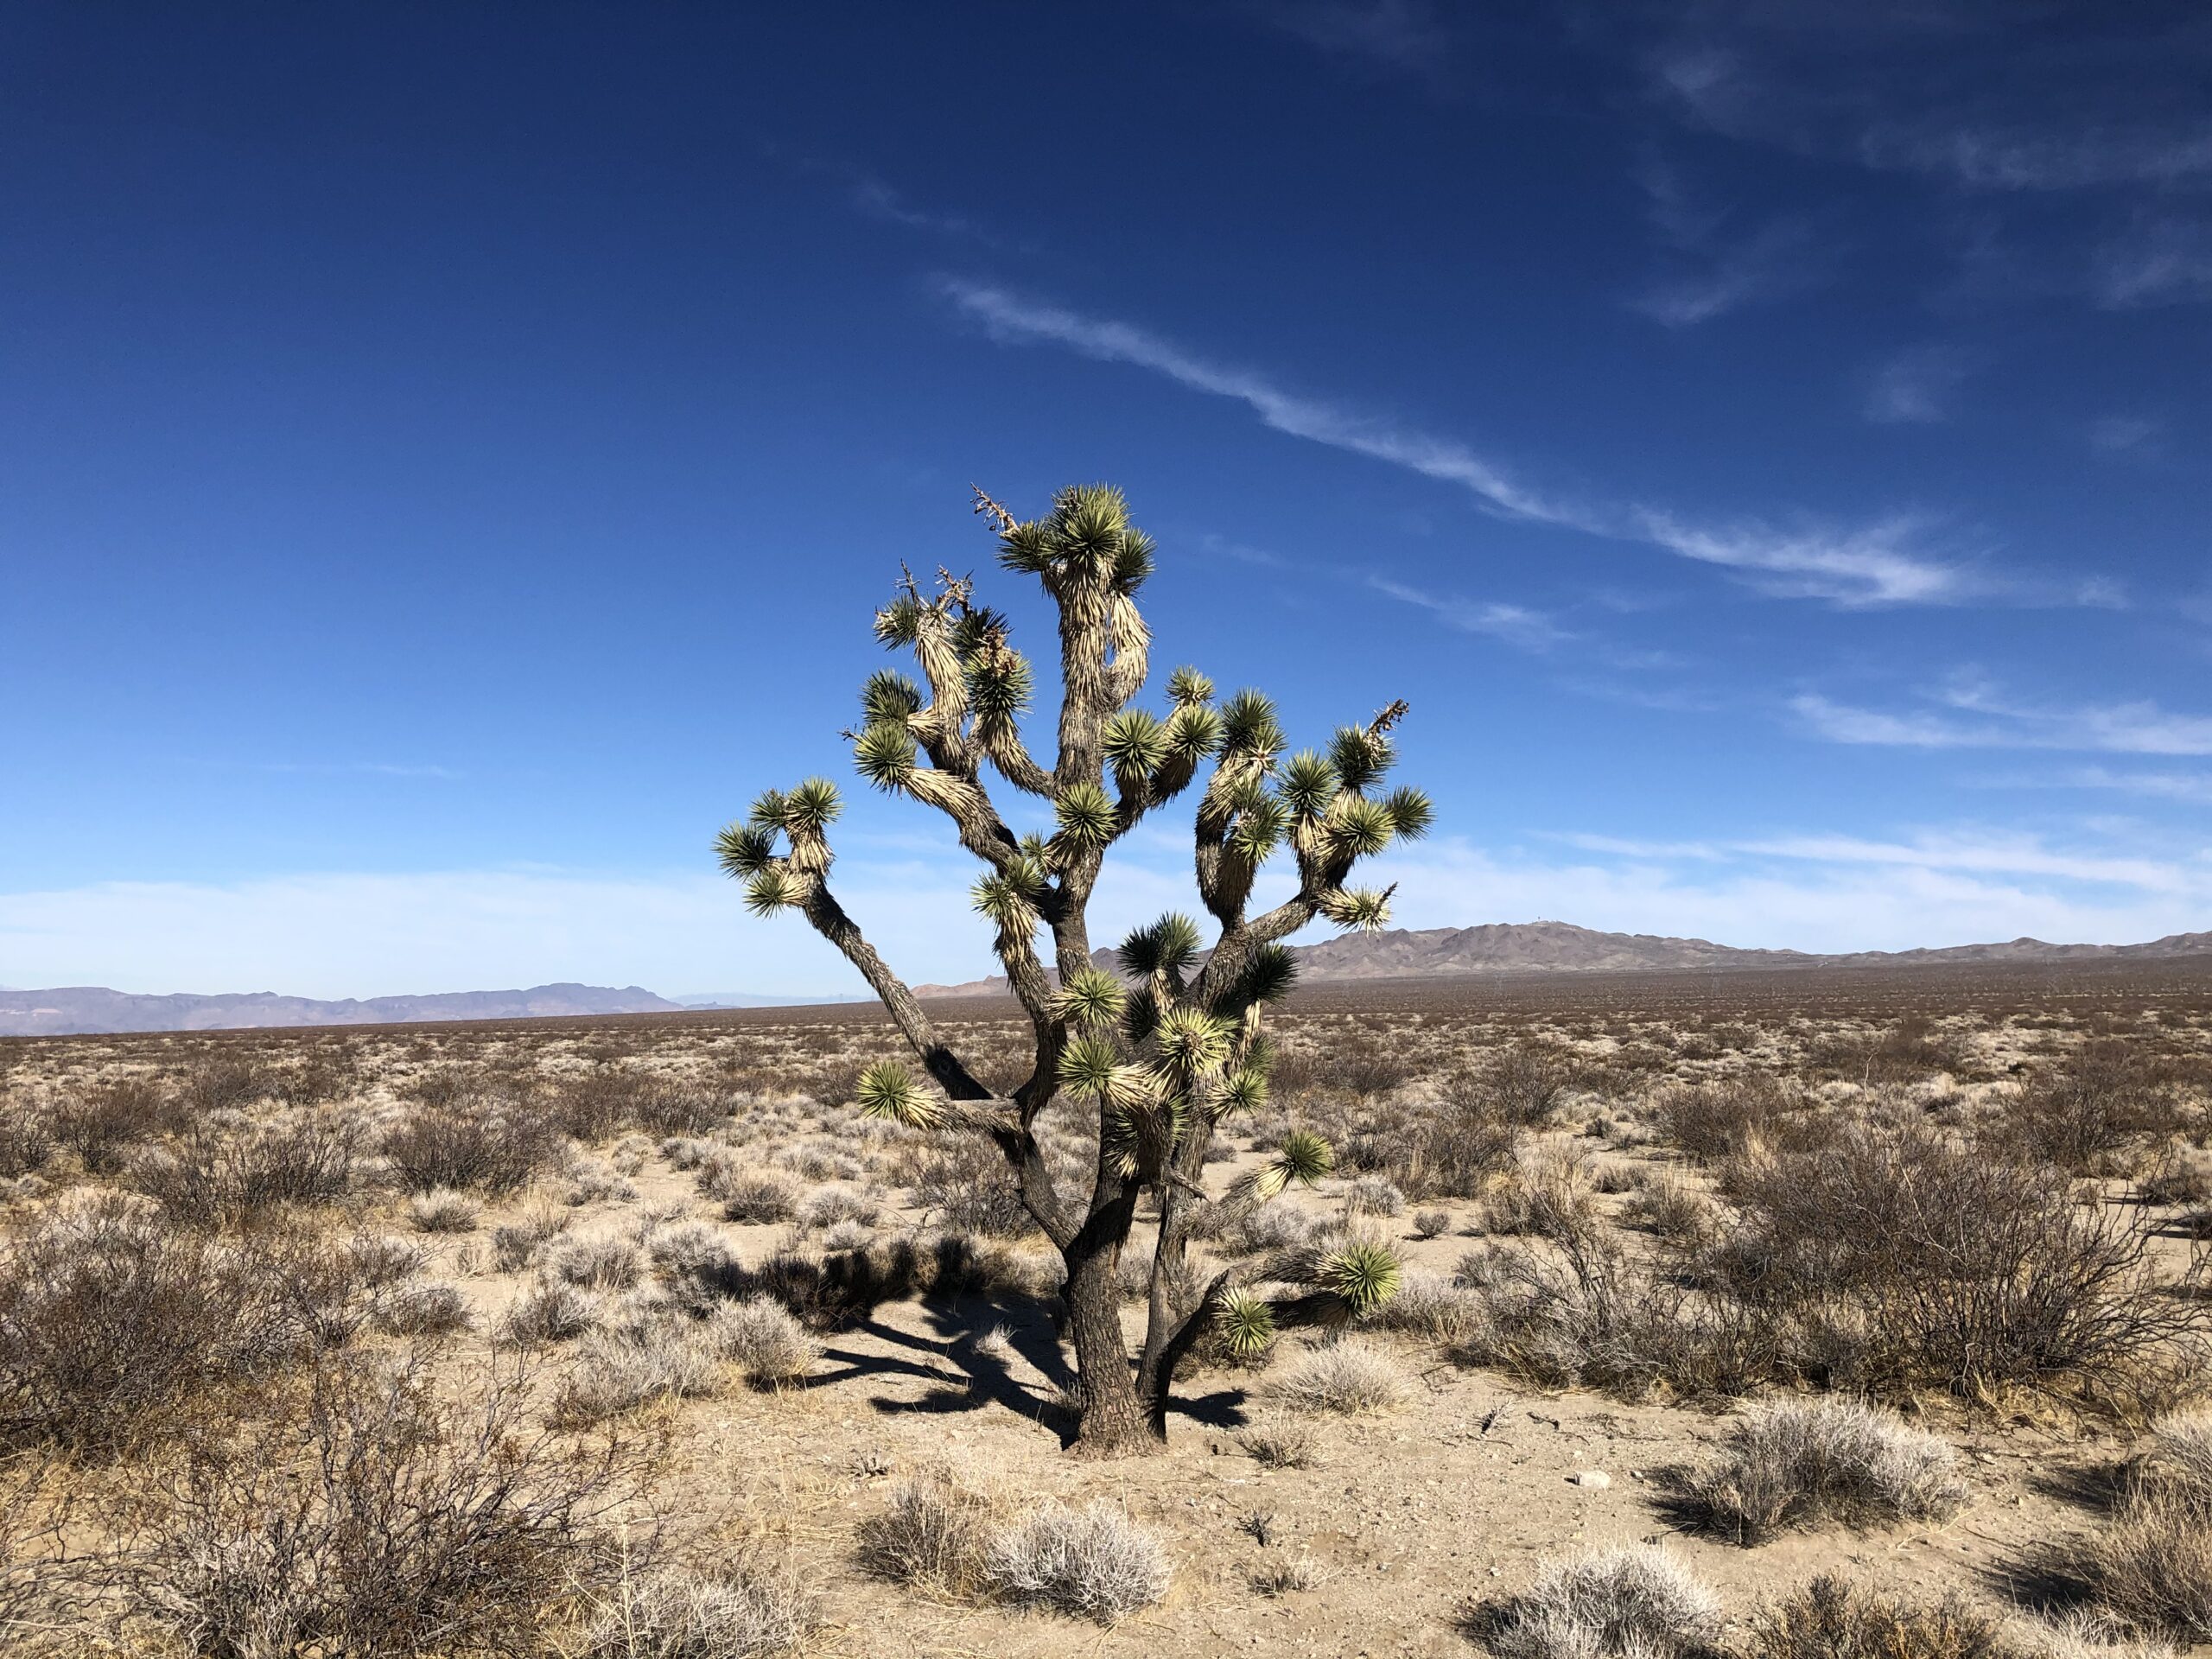
We’ve also made another monthly visit to the 3 common gardens to check on the Joshua trees that are out in the wild. It has rained a couple of times in the past month, which was evident when we went to the gardens! I saw many plants that were putting out tiny new blades (so small that I almost didn’t notice them and had to touch them to make sure they weren’t just a shadow). Other plants still seemed a little heat stressed, with leaf margins that were furled inwards, which could be a reaction from the summer heat that is still noticeable now. We luckily haven’t seen any active rodent herbivory, which would mean setting up traps, but have seen signs of insects – we are slowly trying to learn the difference between grasshopper and ant herbivory.

A fully grown Joshua tree near the Cactus Mine garden

These assessments and garden visits have given us a lot of data, which has provided us quite the opportunity to learn more about how this data is going to be used and what it could signify. It’s been very interesting to think deeper about the research and to consider how the data needs to be set up to make future statistical analysis more efficient and seamless. Maddy and I text Lesley, our mentor/the PI on this project, quite a bit when entering data to double check that we’re formatting it correctly, whether we need more columns or rows, and whether we need to include past data points on our current Excel spreadsheet. I’ve learned to think about it in terms of how the data will be used in the future – do we need to include past data in case of future analysis of trends for these plants? I tend to write a lot of notes when looking at the plants – will these notes be superfluous or could that data be helpful?

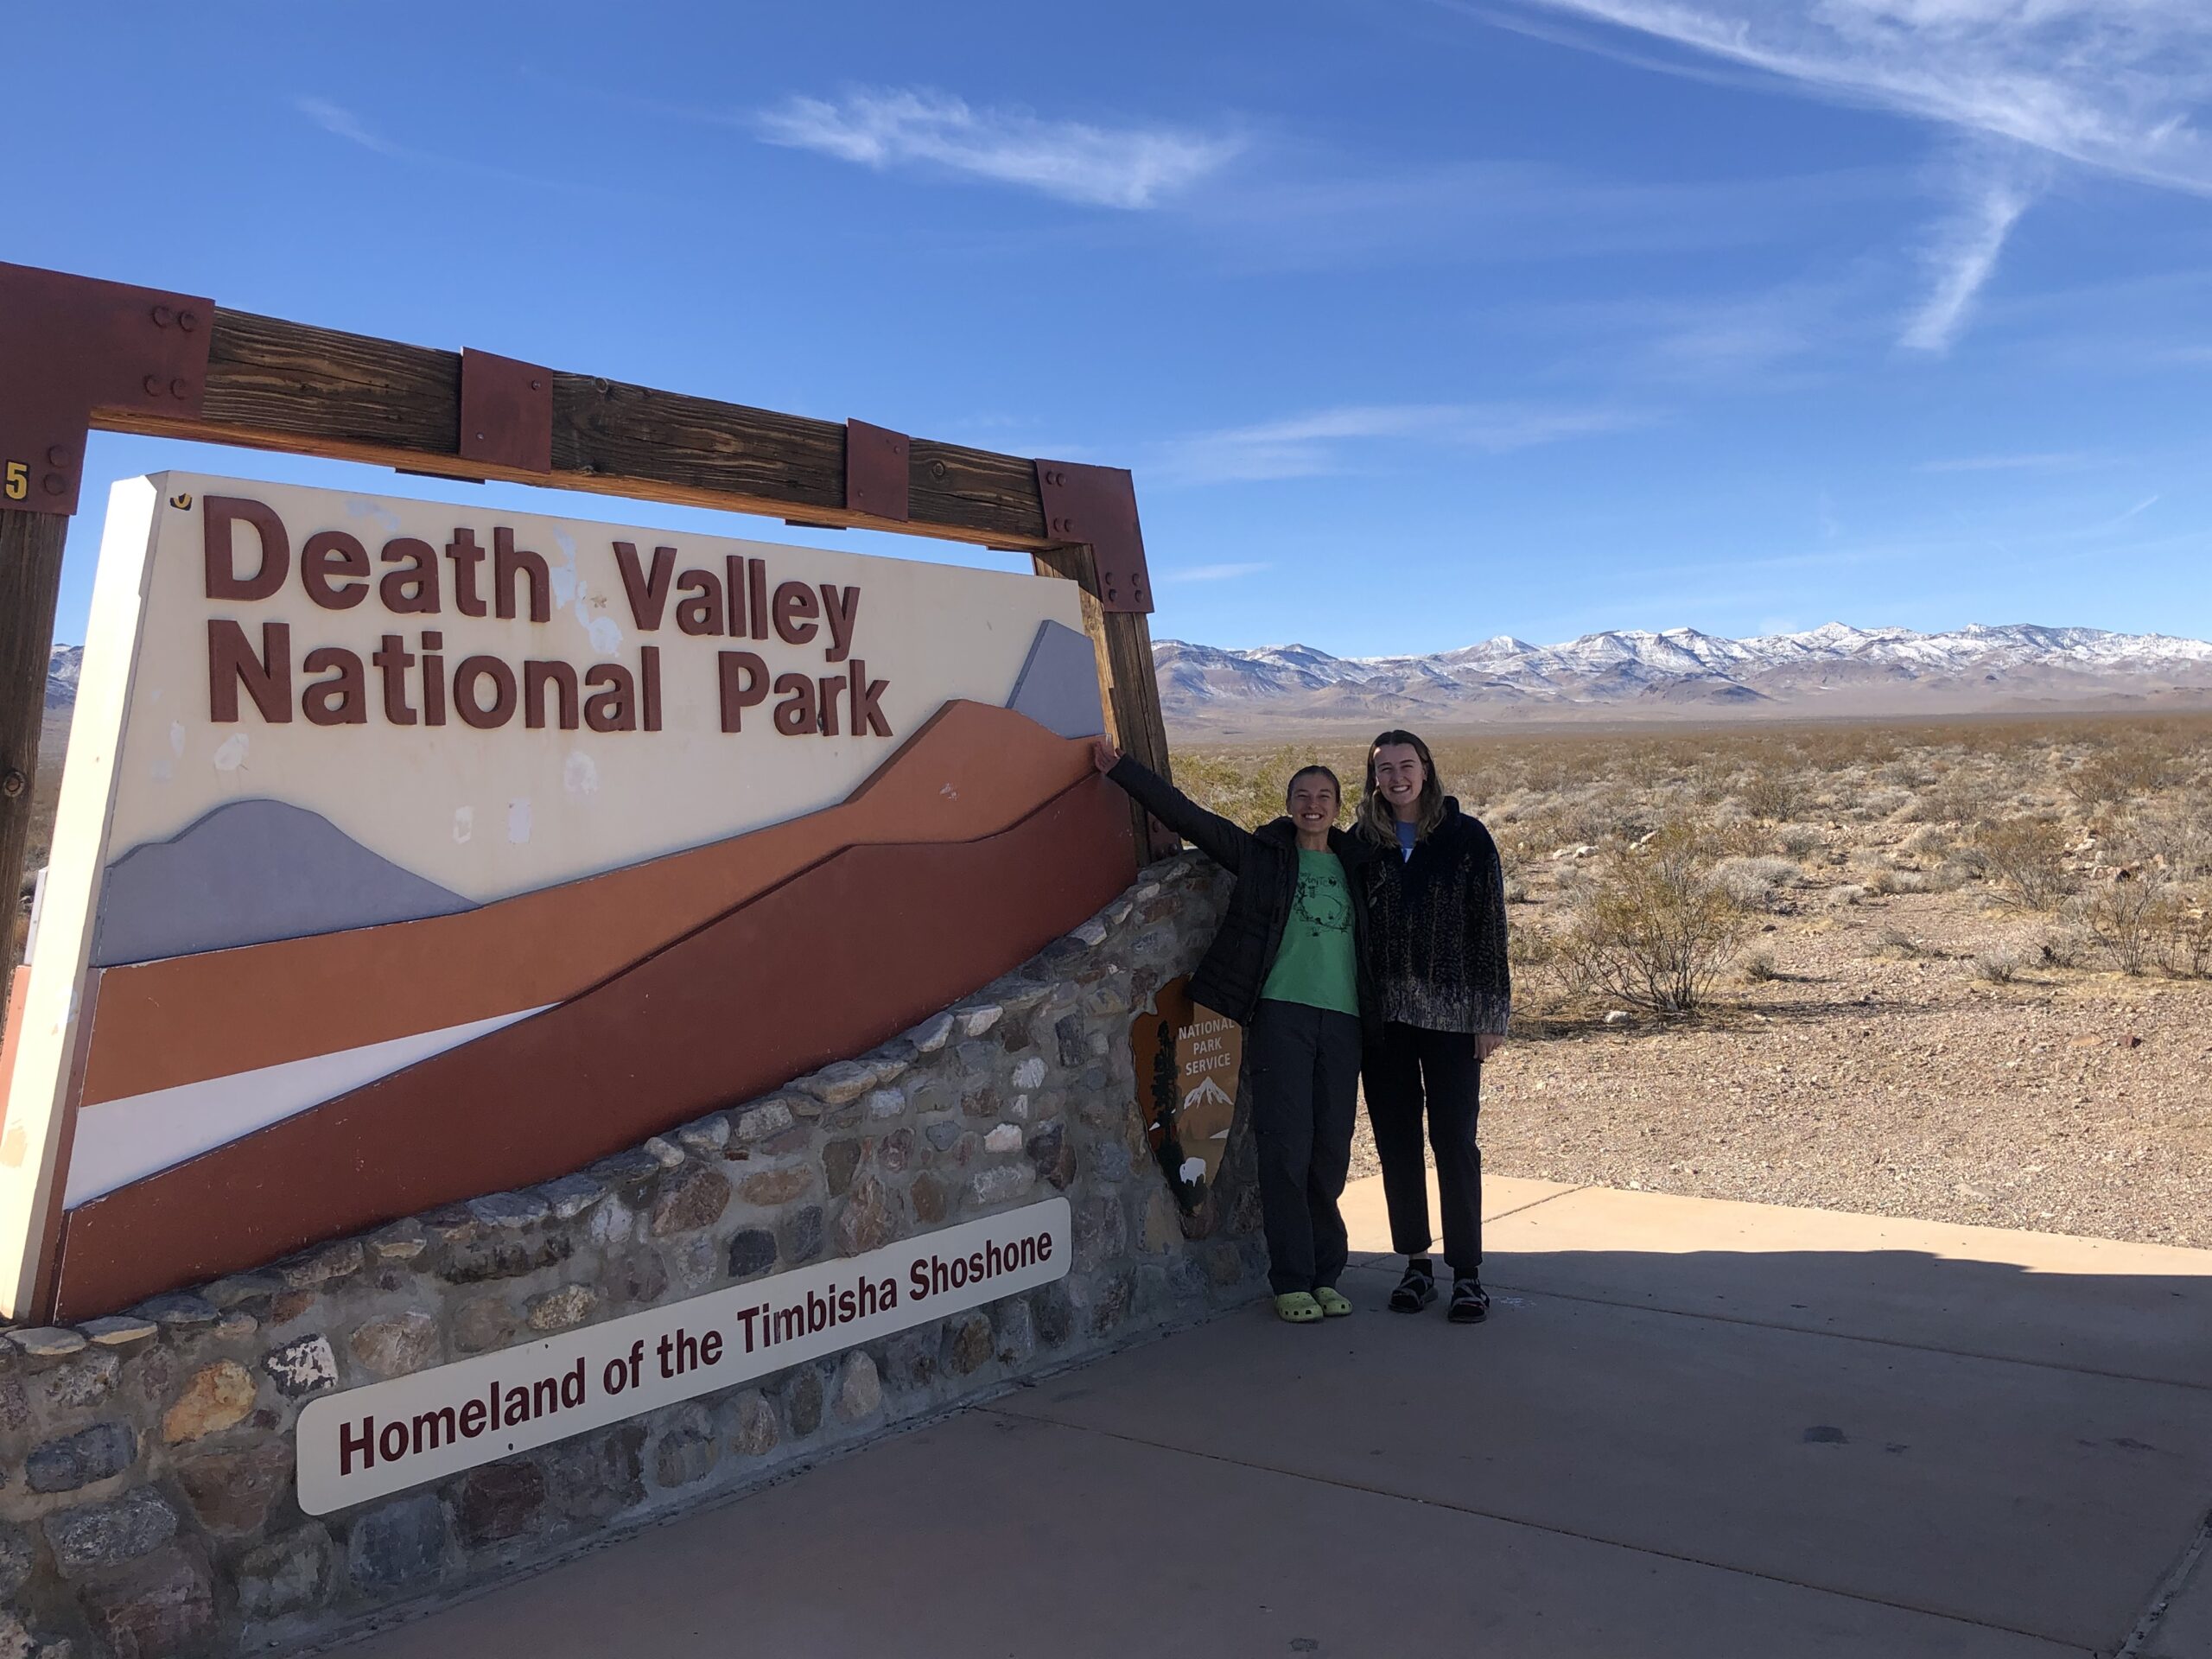
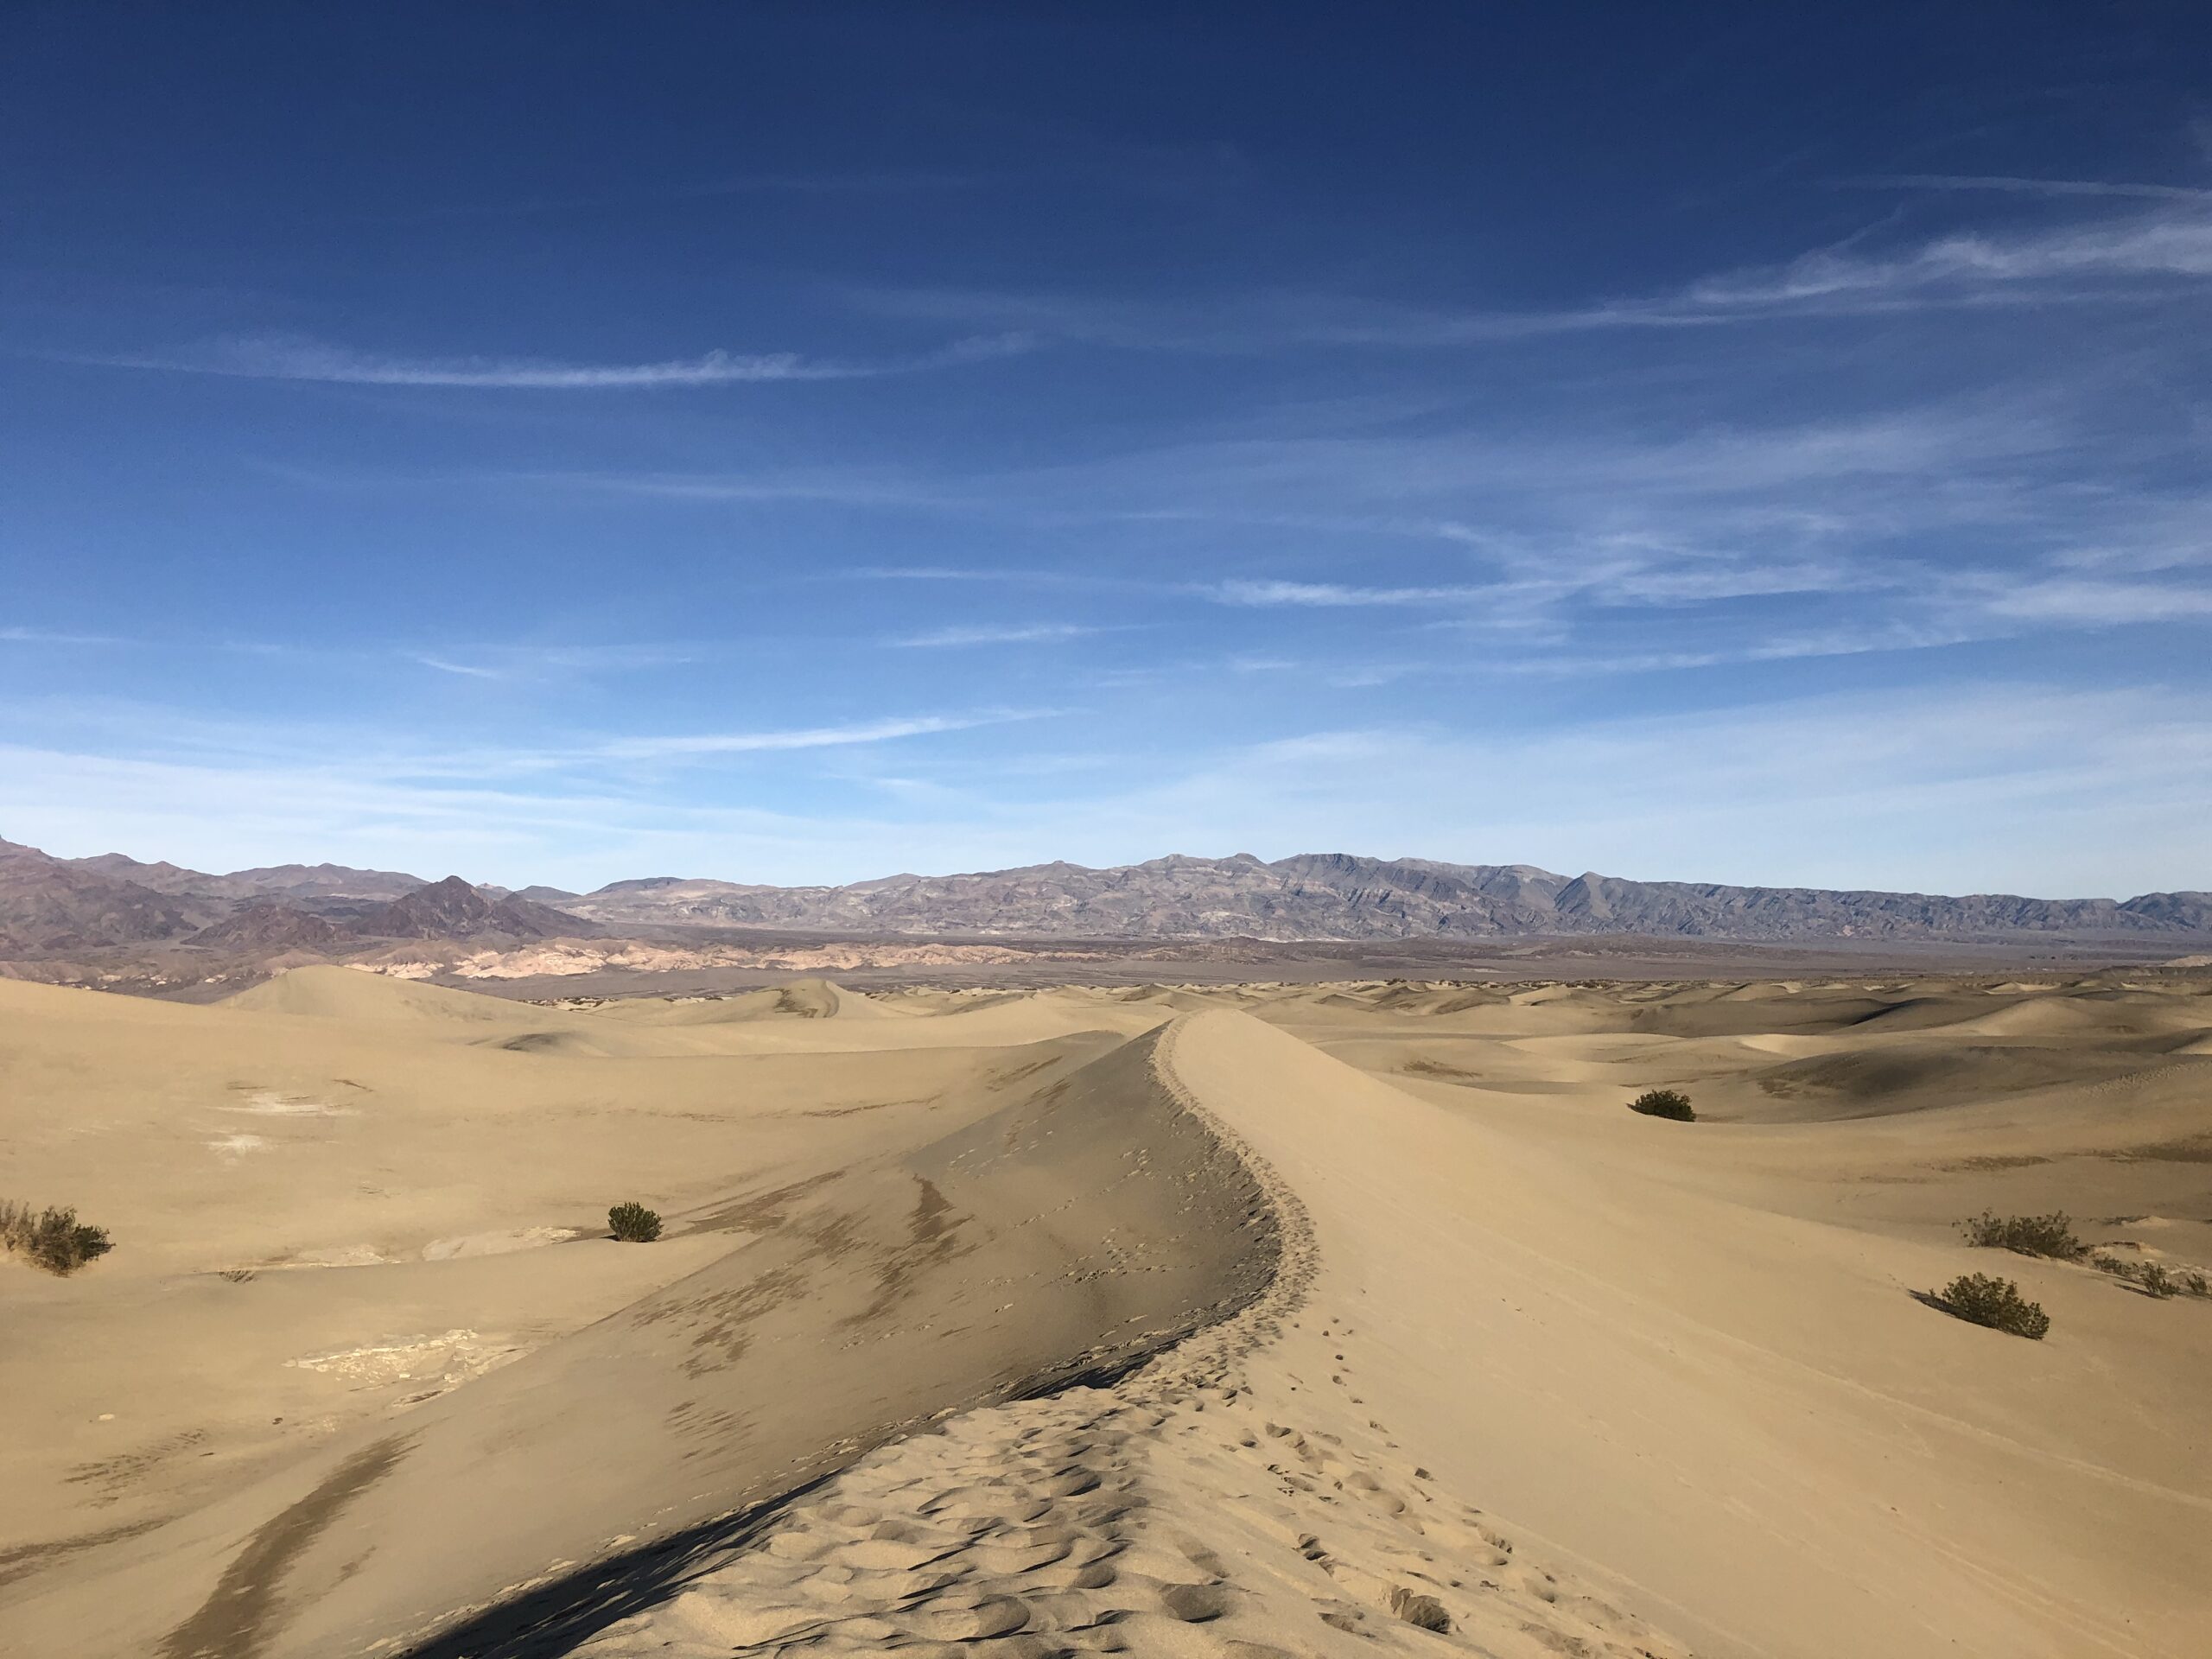
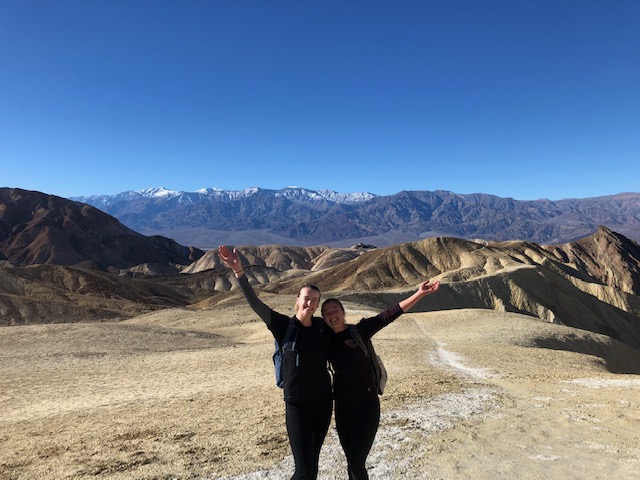
Overall, I’ve still been really enjoying the area! Maddy and I have been hiking every weekend, we camped in Death Valley (which taught us how cold it gets in the desert at night), and we plan to camp in Zion soon. I’m already growing quickly attached to the mountains, and hope that in the future I will still be in an area that has such accessible and beautiful hiking trails.

Maddy and I at the entrance to Death Valley!
We walked along the Mesquite Flat Sand Dunes in Death Valley – it felt like we were in a movie!

Concerns over Water Usage, Drought and the Fate of Joshua Trees

How has it been over a month already? I have no idea. Time flies when you’re getting settled into a new place, a new job, and have so much exploring to do outside of work, too!

Here is a pic of Bridget & I doing just that! Exploring! –Death Valley National Park–

The past few weeks have had a heavy focus on data entry. We’ve needed to enter our records from the assessments we do at the gardens each month that rate the health status (1-3) and herbivory severity (1-5), as well as record the number of live blades each plant has, number of dead blades, and any notes.

That small light-colored trail near my finger tip is what ant herbivory looks like!

At the Cactus Mine and Ridgecrest gardens, the assessment doesn’t take very long between Bridget and I because many of the plants didn’t survive – there are only 23 seedlings still alive at Cactus Mine and 20 at Ridgecrest. Meanwhile, the Utah garden has a whopping 284 seedlings that are alive and —for the most part—well! This does mean a lot more crouching or kneeling, back up to standing, then shifting over to the next plant, and back down again, for Bridget and I as we assess about 140 plants each! Although it’s more uncomfortable for a longer period, it’s exciting to have one of the gardens flourishing! We are thinking the trees are doing so well here because it gets the most rain and is also the coolest out of the three. At the other end of the spectrum, Ridgecrest is the hottest and driest.

one happy plant at our flourishing Utah garden 🙂

Joshua Tree seeds have evolved to rely upon rains to germinate, which makes sense why the wettest garden would be performing the best. Unfortunately, looking at current and predicted climate trends, this is concerning because these rains that the Joshua Trees depend on to create new generations are not happening as often. Nevada officially declared a drought in 2002 that has continued to current times. Drought.gov provides information on current and historical (since 2000) drought conditions: currently, 68.1% of Nevada is in a severe drought, 24.2% is in extreme drought, and 7.5% is classified as exceptional drought.

Coming from a place of excess water, the idea of droughts and declining water source levels scares me. Along with this comes frustration that we are not doing enough to reduce water usage. At the individual level, around Las Vegas/Henderson/Boulder City, some houses have grass-covered lawns –one right outside of work even has sprinklers spraying their grass. It would be much better if they planted more native desert species and removed water-consuming grass. At the industry level, resorts use a lot of water mostly from hotel guests, who use more than 63 gallons per day on average, according to this article by Sam Bruketta, 2020. Although many resorts have been working to reduce water usage, such as MGM Resorts, which has reduced water use by 25% since 2007 (Bruketta, 2020). However, a truly unnecessary use of water is the Bellagio Resort fountains, which have been scrutinized for losing about 12 million gallons per year from evaporation (Bruketta, 2020). A different type of industry, is one of the biggest sinks of water, from watering grass on a larger scale than the individual homes mentioned earlier: golf courses. According to the Las Vegas Water District website, golf courses in Southern Nevada use an average of 725 acre-feet per year. My brain has a hard time imagining what this means… The Water Education Foundation website states that one acre-foot is approximately 326,000 gallons of water, and would cover one football field in a foot of water. So, for a visual of what an average Las Vegas golf course would use in a year, it would be enough to fill a 725 foot deep, football field-sized swimming pool! That is an insane amount of water.

The site also mentions that California households use about ½ – 1 acre-feet of water on average per year: about 163,000-326,000 gallons of water per year, each. That estimate brought my thoughts to the lifestyle I had this summer while living in a dry cabin in the woods of Alaska where I was working at the time. I’d never heard of a dry cabin before starting my housing search, but it was the cheapest option —for good reason— because they are cabins without running water, which means no toilet, no shower, no faucets of any kind. I was scared to live like that for three months having never been in a situation like that (besides short term circumstances when camping out for a few days). However, it made me realize how much water I use and waste under normal circumstances with the luxury of indoor plumbing —leaving the water running while washing hands, doing dishes, taking showers, or even flushing the toilet— everything!

this is my adorable little dry cabin in the woods that I miss!

How the water situation worked in a dry cabin, was we had two clear, five-gallon jugs that we’d fill up at the water-filling station in town, and set up on the counter over the sink which drained into a five-gallon bucket that we’d dump outside. And unfortunately, we did have a few times when we didn’t realize the bucket was nearly full, and spilled over some foul smelling water with chunky food bits/oily residue onto the floor as we scooted it out from under the counter to dump… Aside from those “oh crap” moments, overall, living in a dry cabin really wasn’t so bad!

With the goal being to take as few trips as possible to the water filling station; using as little water as possible to wash hands, do dishes etc. was the primary way to achieve this. We were so careful to reuse water when possible and use the bare minimum amount we could to get the job done. Although I dreaded the idea of living in a dry cabin at first, I’m so glad I had that experience to teach me so much about conserving water, which I’ve tried to hold with me since then. It makes me wonder if everyone lived like that for even one week, what difference it could make on our water usage overall in the US, especially in dry regions like this, where we need to be doing more.